What Ballot Initiatives Actually Cost
Ballot initiatives are costly. Qualifying a measure for the ballot, building a statewide campaign, and reaching millions of voters requires what can feel like obscene amounts of money. But how expensive are initiatives, really? We address this question by exploring the costs of signature gathering for qualifying initiatives and of campaigns for and against initiatives in even years from 2014 to 2024.1 We recognize that focusing only on initiatives that successfully qualified for the ballot鈥攁nd not on the many efforts that did not鈥攑resents methodological challenges. Initiatives that reach the ballot are likely to be better funded and organized from the start, and in more permissive institutional environments, than those that do not. As a result, our analysis likely underestimates the costs of attempting an initiative and may obscure how institutional barriers undercut campaigns before they become observable.
Signature Costs Vary Widely, and They鈥檙e Rising
The most consequential expense in the initiative process occurs before voters even engage with a proposal. High qualification costs influence agenda control by determining which issues even reach the ballot. When ballot access depends heavily on fundraising capacity, well-resourced actors can gain disproportionate influence over which policy questions are posed to voters, while proposals lacking wealthy or institutional backing may never advance to public debate.聽
Sponsors of initiatives typically use some combination of volunteers or paid circulators to collect voter signatures to qualify for the ballot. The signature-gathering process is a consistent and substantial expense, and one of the first barriers that sponsors of ballot measures encounter. As Figure 1 shows, in recent cycles, the average cost of gathering signatures represents about a fifth to a quarter of total spending in support of initiatives鈥攁 significant down payment that sponsors must make in the ballot initiative process.
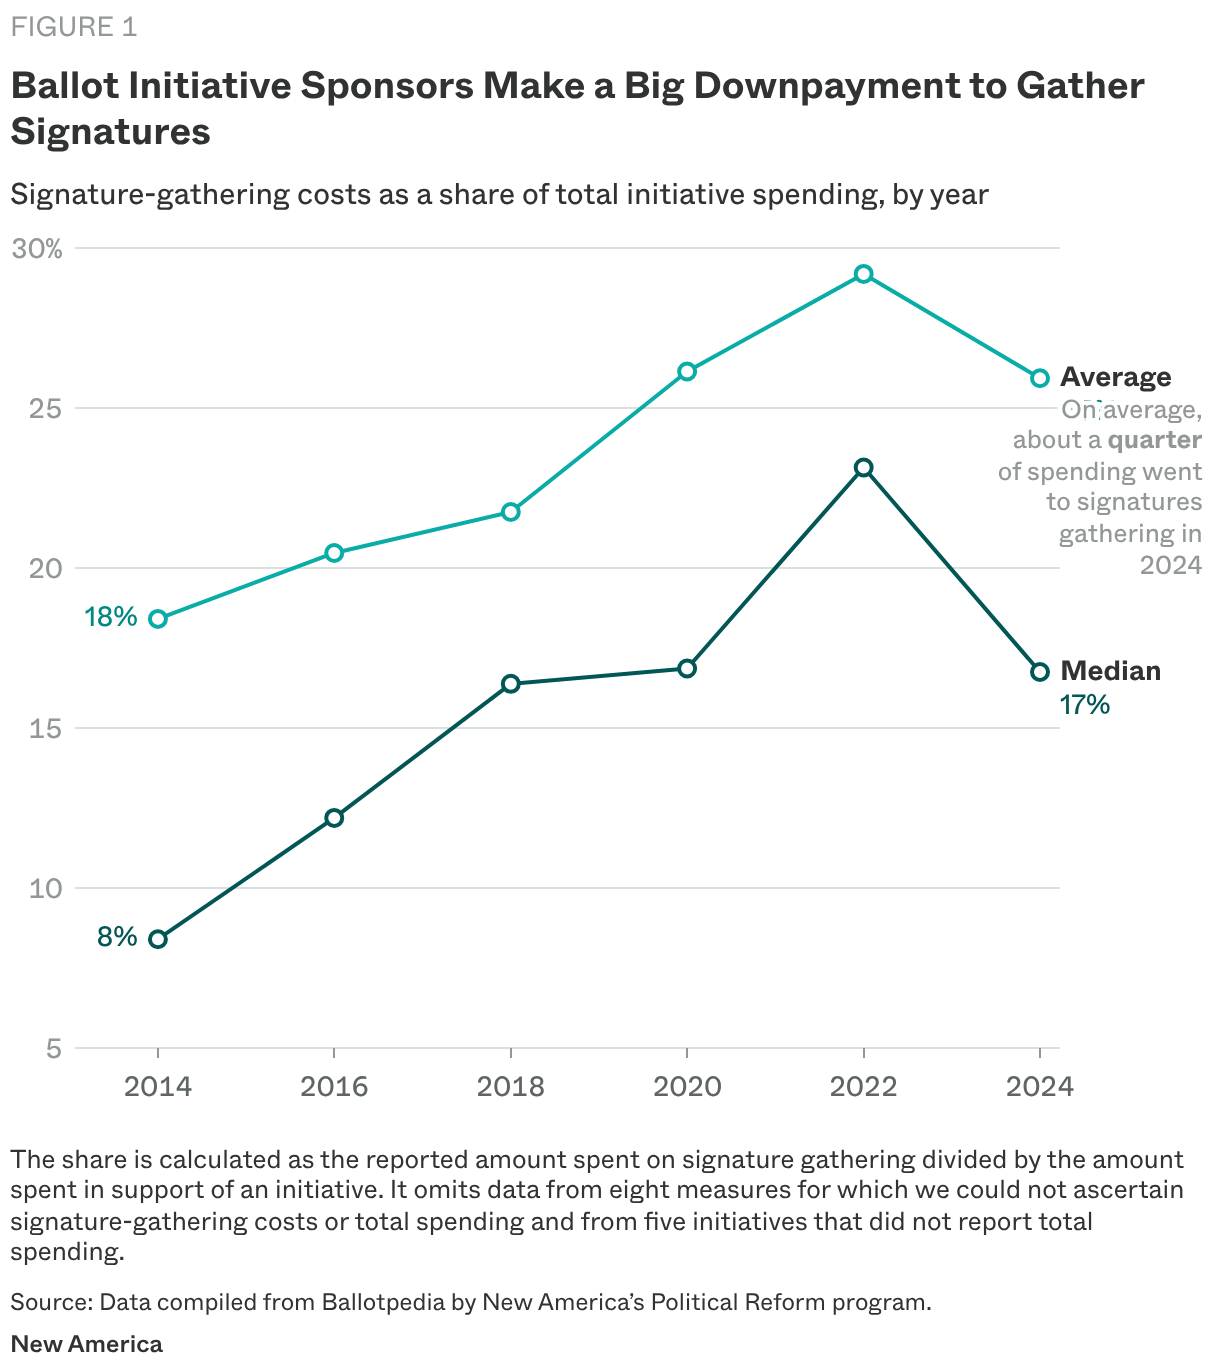
These costs reflect specific process design choices. Signature thresholds, geographic distribution requirements, petitioner restrictions, and circulation timelines each affect the difficulty of qualification. In recent years, legislative changes in several states have raised qualification barriers. Arkansas, for example, increased the number of required counties for gathering signatures from 15 to 50, contributing to one of the highest cost-per-signature figures observed. Rules of this kind function as cost multipliers that disproportionately hurt grassroots campaigns.聽
In addition to institutional design choices, the cost per signature can be influenced by the measure鈥檚 topic and popularity. For some measures, the heavy lifting is securing enough signatures to qualify, but once approved, the initiatives sell themselves to voters, and sponsors don鈥檛 spend much more to support them. For example, in 2024, about 70 percent of the money spent in support of Maine鈥檚 2024 initiative to limit contributions to Super PACs went to gathering signatures to qualify the measure for the ballot, and only about a third went to other supporting costs. The measure passed with close to 75 percent of the vote.聽
In other states, as shown in Figure 2, signature-gathering labor costs can be as low as zero because sponsors used volunteers to collect signatures, as they did in Idaho and South Dakota in 2024. However, no petition process is totally free: Even all-volunteer campaigns face administrative and operational expenses鈥攊ncluding printing, materials, and voter data鈥攖hat can be significant depending on the state and scale of the effort. The figure also shows that for the 2024 cycle in Maine and Oregon, most of the money spent in support of initiatives went toward signature gathering. Maine had only one initiative: the initiative limiting super PAC contributions mentioned earlier. Oregon had two. One was a failed initiative to enact a corporate tax revenue rebate for residents, for which supporters spent $702,676 to qualify the measure for the ballot out of a total of $873,369 spent in support of the measure (a total of $17,481,126 was spent to defeat it). The other was a successful initiative for the unionization of cannabis workers, for which supporting groups spent close to 60 percent of support resources in gathering signatures.
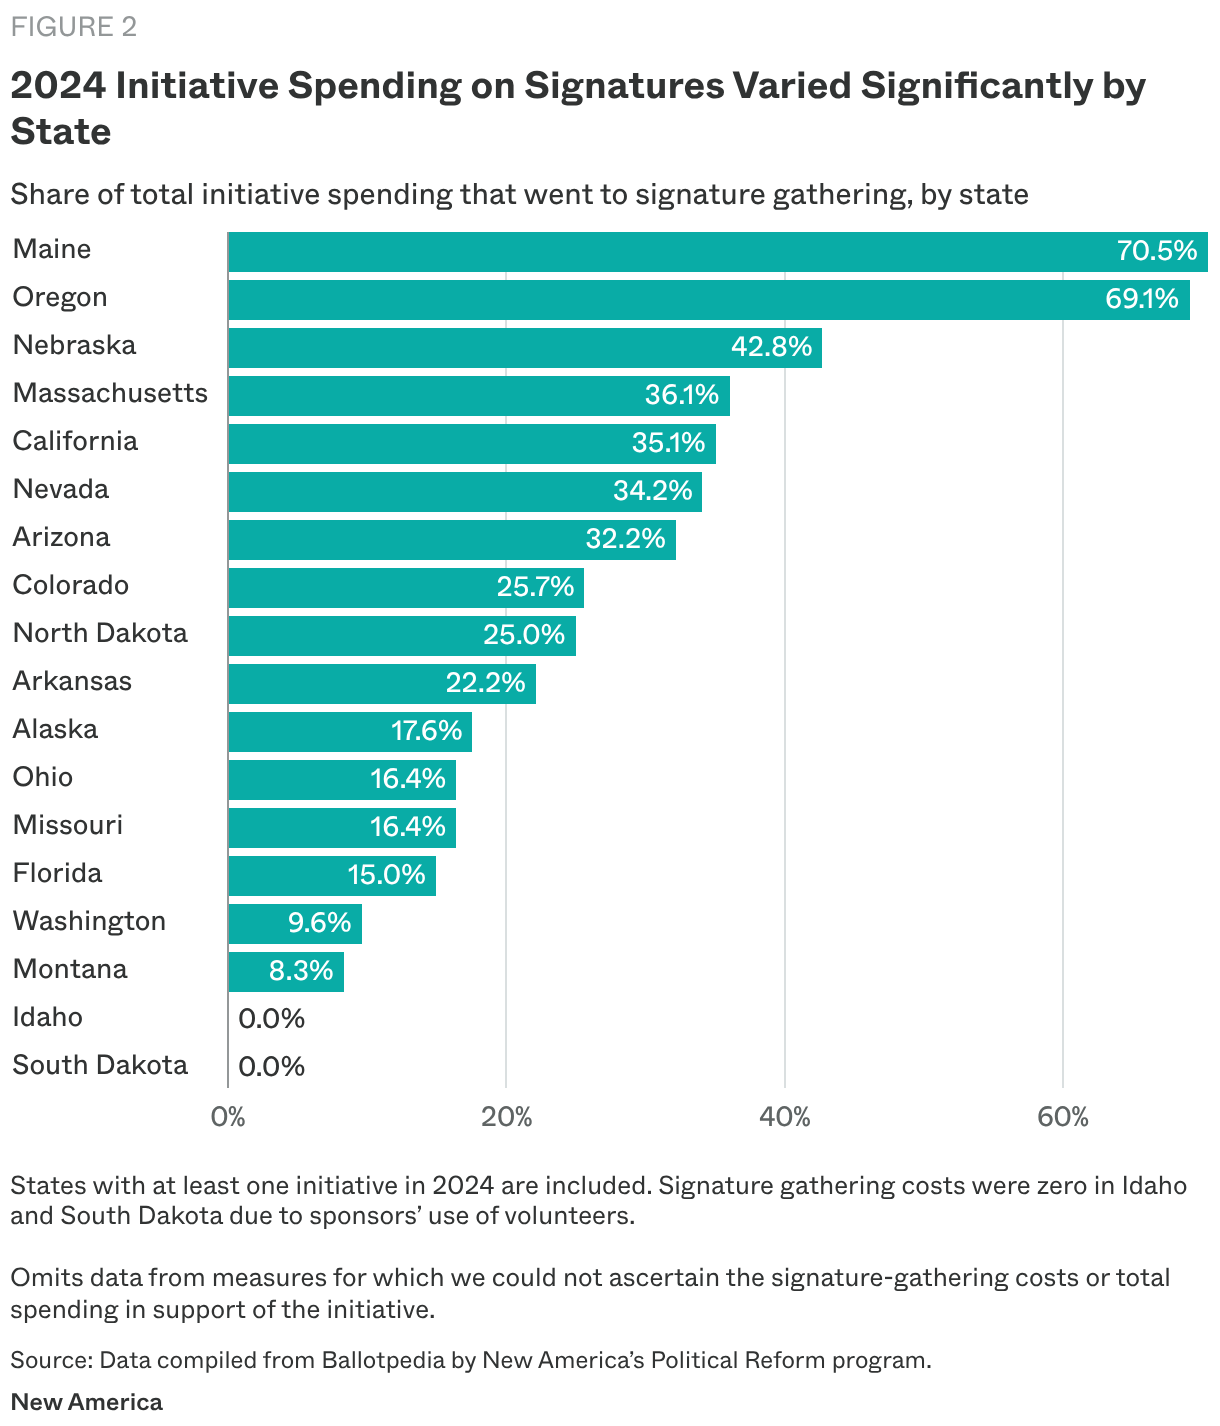
Figure 3, which includes data from 2012 to 2024, shows that signature-gathering costs vary dramatically by state. Signature-gathering costs have also risen sharply from a median of $314,789 in 2012 to $5,822,657 in 2024, and the range of spending on signature gathering has widened, driven by increased spending in a few states.聽
On average, sponsors of initiatives in California and Florida spent more in absolute terms on signature gathering than sponsors in other states in most years. These averages hide variation in the number of measures in these states and in the amount spent to get them on the ballot. Given its large population and the number of initiatives that make it to the ballot, sponsors in California consistently outspend sponsors elsewhere in signature collection almost every year. In 2012, groups in California spent a total of $28,244,069 collecting signatures for 13 initiatives (an average of $2.17 million per measure); in 2024, they spent a total of $42,318,319 on five initiatives (an average of $8.46 million). In contrast, groups in Florida spent a total of $41,236,917 on signatures for just two measures in 2024 (an average of $20.62 million).
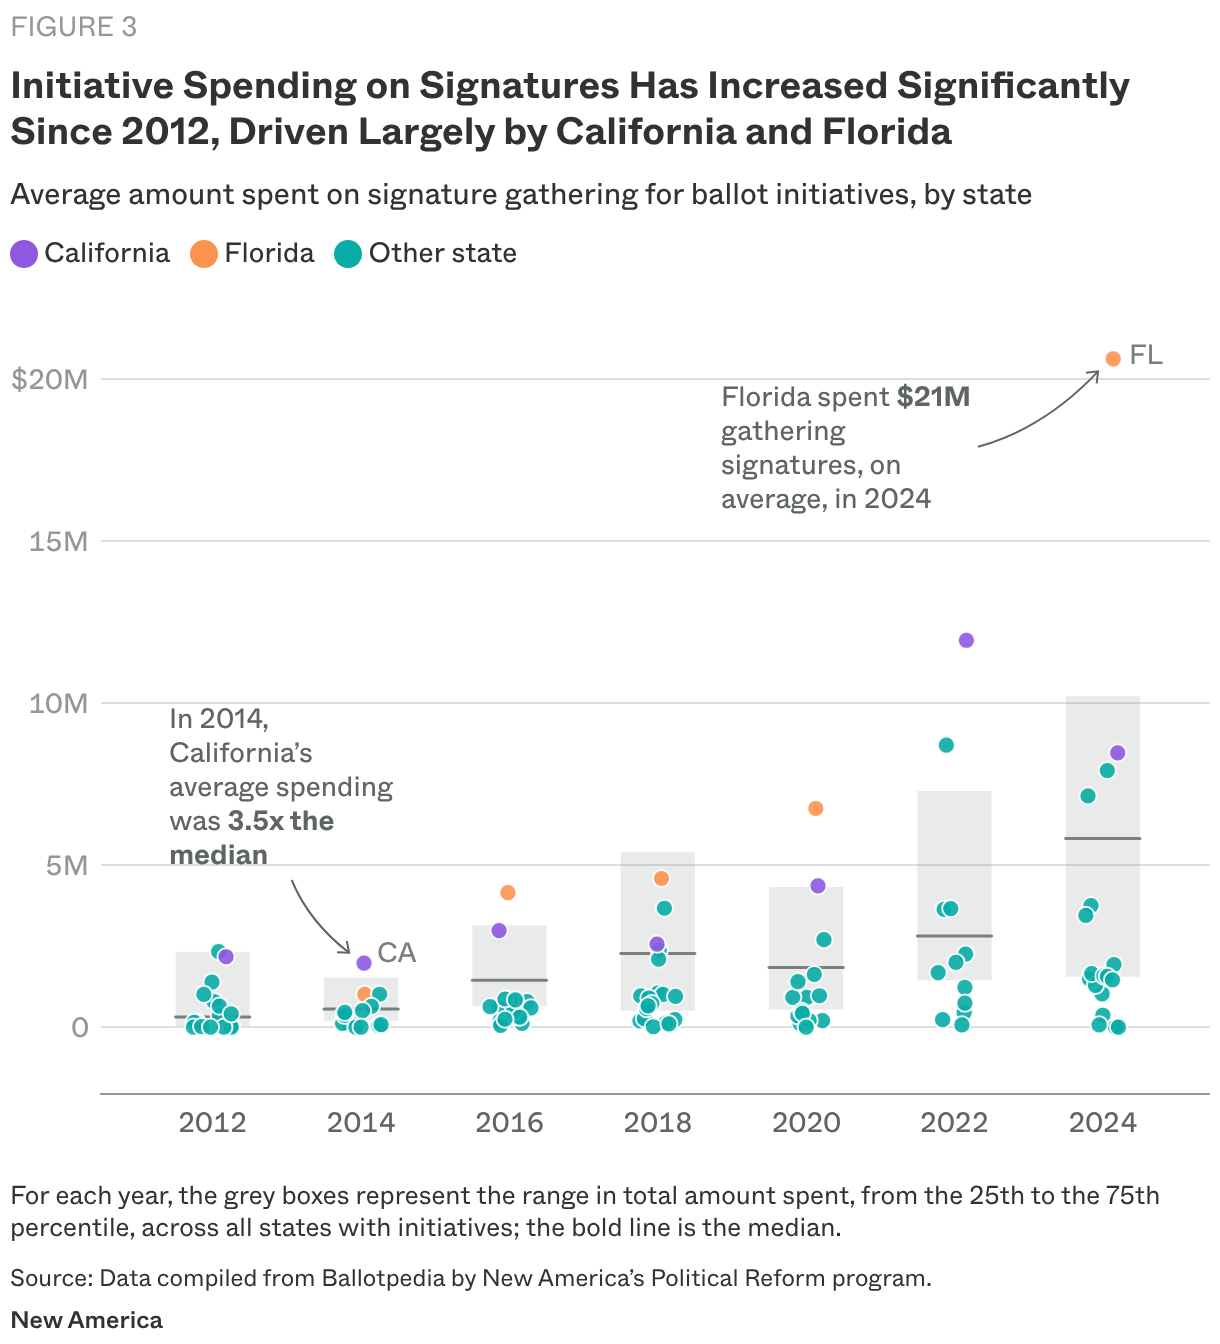
In other states, the average amount of money spent on signature gathering is orders of magnitude lower than in California and Florida. In Colorado, which had the most ballot measures in 2024, sponsoring groups spent an average of $1.49 million on signature gathering. Groups in Massachusetts spent an average of $1.29 million. In 2024, the lowest average amounts spent on signature-gathering labor were by groups in North Dakota ($70,051) and Alaska ($368,215), though the direct costs could be as low as zero when groups relied on volunteers, as in Idaho and South Dakota. Again, these low-budget, volunteer-run petition drives are rare.聽
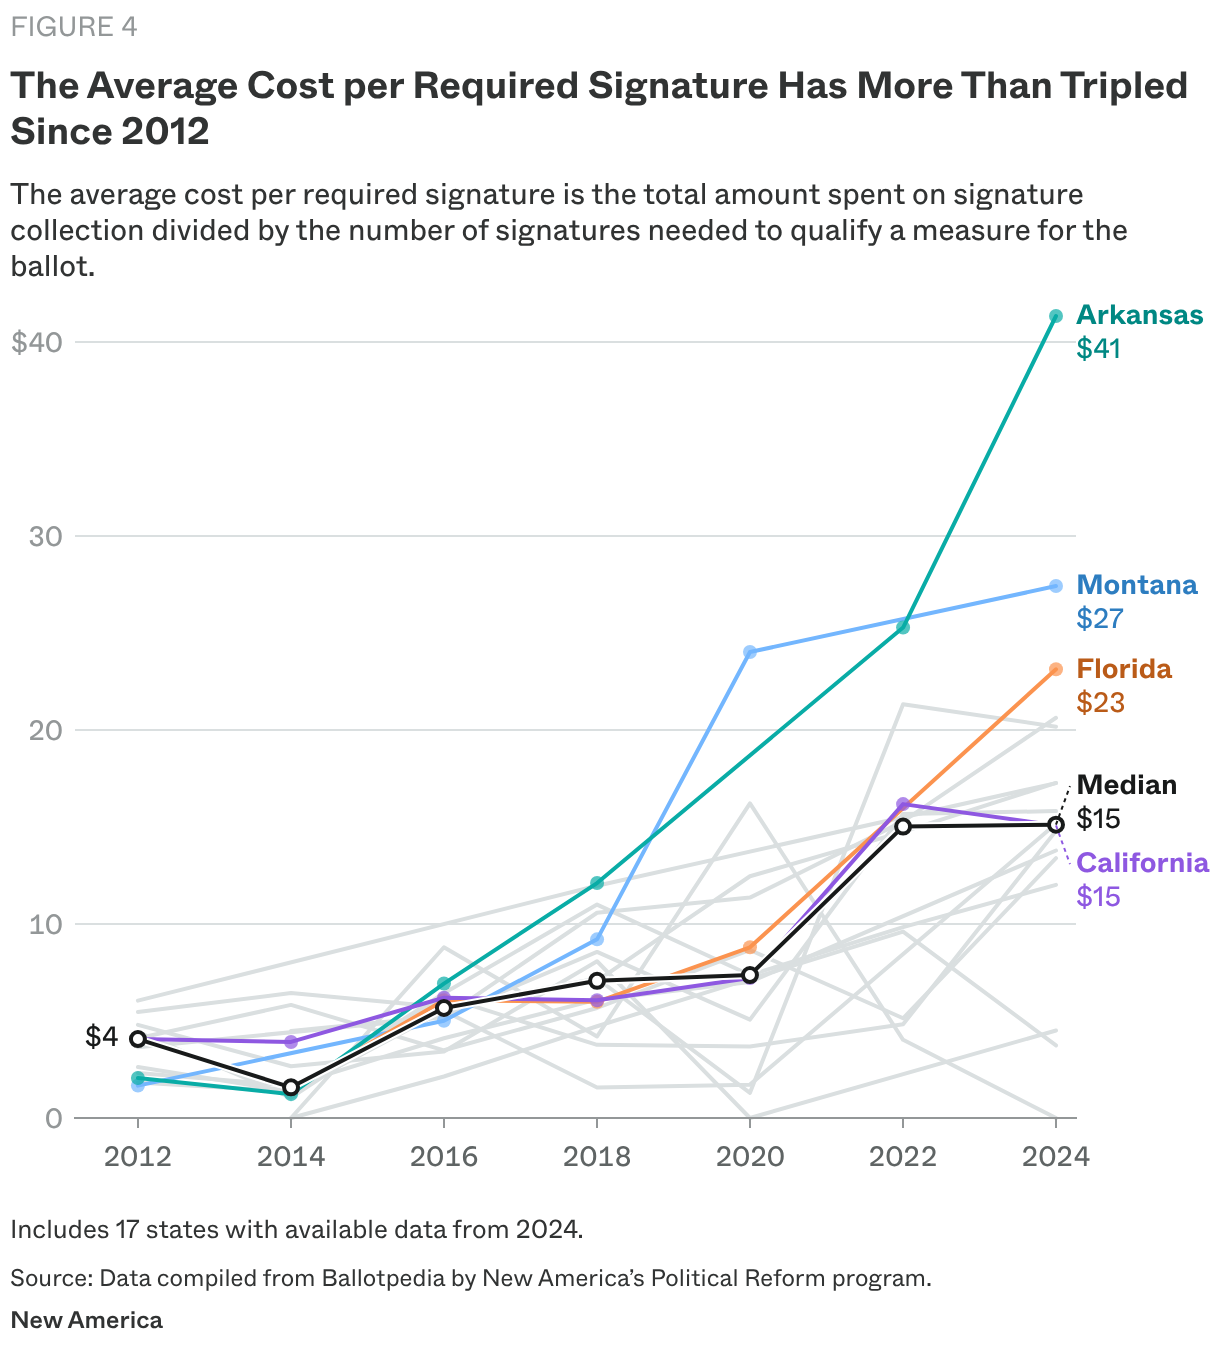
Another useful metric to compare the costs of collecting signatures鈥攁nd one that gives a better sense of the distinct financial challenges of signature gathering across states鈥攊s Ballotpedia鈥檚 . This metric divides the total amount spent on signature collection by the signatures required to qualify a measure for the ballot. For example, sponsors of Arkansas鈥檚 Issue 2 in 2024 (for casino license regulations) needed to collect 90,704 signatures to qualify and spent $3,750,123, for a cost per required signature of $41.34. Meanwhile, in California, qualifying a measure on the ballot required 623,212 signatures in 2022. For Proposition 32 (on minimum wages and on the 2024 ballot), sponsors spent $8,837,160, for a cost per required signature of $14.18. The average cost per required signature inflates the cost per signature borne by campaigns as it divides by the minimum number of signatures required and not the total number of signatures a campaign actually obtained, which is usually substantially higher.
Figure 4 shows that the average cost per required signature per state has increased from 2012 through 2024. Unlike total and average spending, the states with higher average costs per signature are not California or Florida. In 2024, the highest average cost per required signature was in Arkansas ($41.34), followed by Montana ($27.42). In 2022, Arkansas also had the highest average cost per required signature ($25.28), followed by Missouri ($21.33). In 2020, Montana had the highest cost per required signature ($24.02), followed by South Dakota ($16.22). In Arkansas, the legislature has recently added restrictions and additional requirements to the signature-gathering process: In 2021, SB 614 added restrictions on the payment and recruitment of circulators; and in 2023, HB 1419 increased the number of counties from which petitioners need to gather signatures from 15 to 50. Laws like these add burdens to the initiative process, raising costs for sponsors.
Petitioning costs are often steep, but they are not inherent to direct democracy itself. Rather, these costs reflect the current practice of electoral politics in the United States. Signature-gathering costs are largely a product of unreasonable campaign finance laws, population size, the measure鈥檚 popularity, and process design choices: signature thresholds, geographic distribution requirements, and circulation timelines.聽
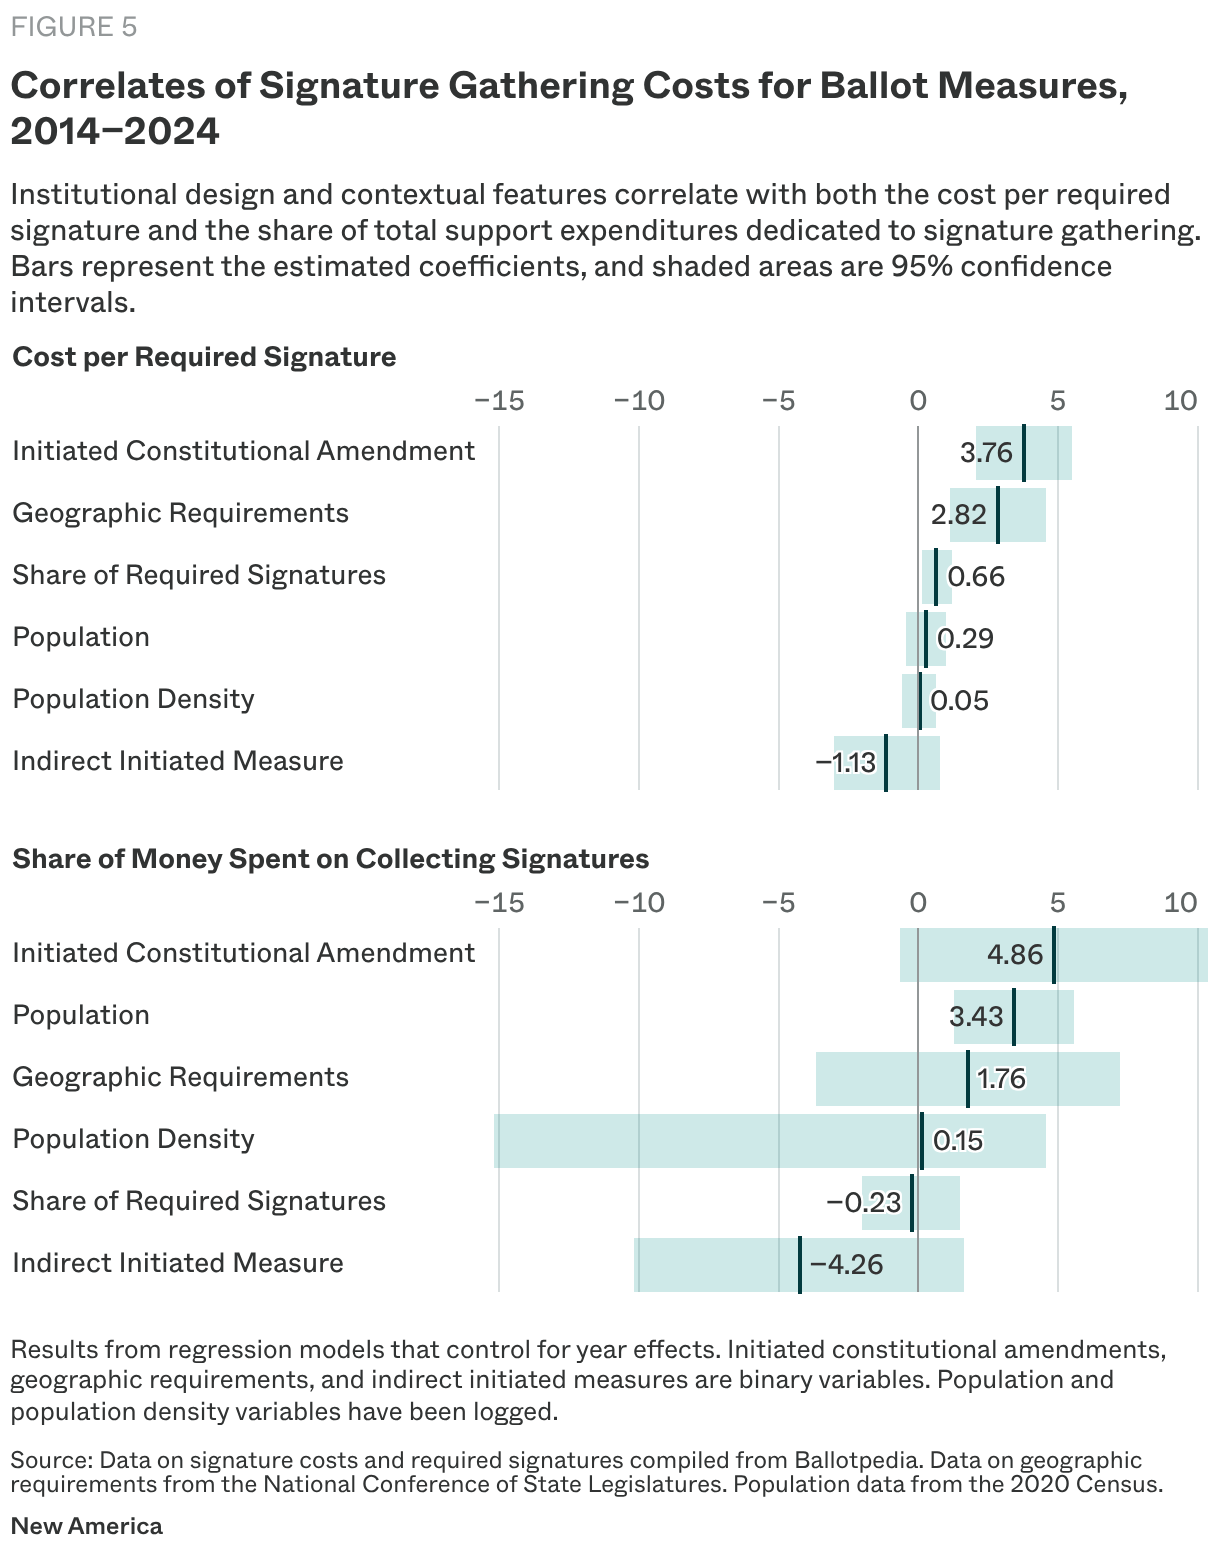
Of these factors, we found that petitioning for constitutional amendments (rather than statutes or referendums), geographic requirements, and the state鈥檚 population significantly affect signature-gathering costs, as shown in Figure 5. Our analysis indicates that, controlling for year-specific effects, the cost per required signature for initiated constitutional amendments was, on average, $3.76 higher than for initiated statutes or veto referendums. The cost per required signature was also higher among measures subject to geographic requirements. Each percentage-point increase in the share of voters whose signatures are required is associated with an average increase of $0.66 in the cost per required signature. We also analyzed differences in the share of total support expenditures spent on signature gathering and found that, on average, it increases with population. To be sure, these findings reflect the costs associated with successful ballot qualification. Because this data excludes initiatives that failed to qualify or were deterred by high entry barriers, these figures may be subject to selection bias.
Campaign Spending Is Concentrated in Two States
Overall campaign spending is even more concentrated than signature costs. A small number of initiatives in a few states鈥攅specially California and, more recently, Florida鈥攁ccount for a disproportionate share of ballot initiative expenditures nationwide. As shown in Figure 6, in general election years from 2014 through 2024, 16 of the 20 ballot measures with the most total expenditures were in California, two were in Florida, one was in Nevada, and one was in Michigan. California鈥檚 2022 reported the most total spending in this time period by far ($403 million). It was followed by California鈥檚 2020 ($223 million), and Florida鈥檚 2024 ($185 million).
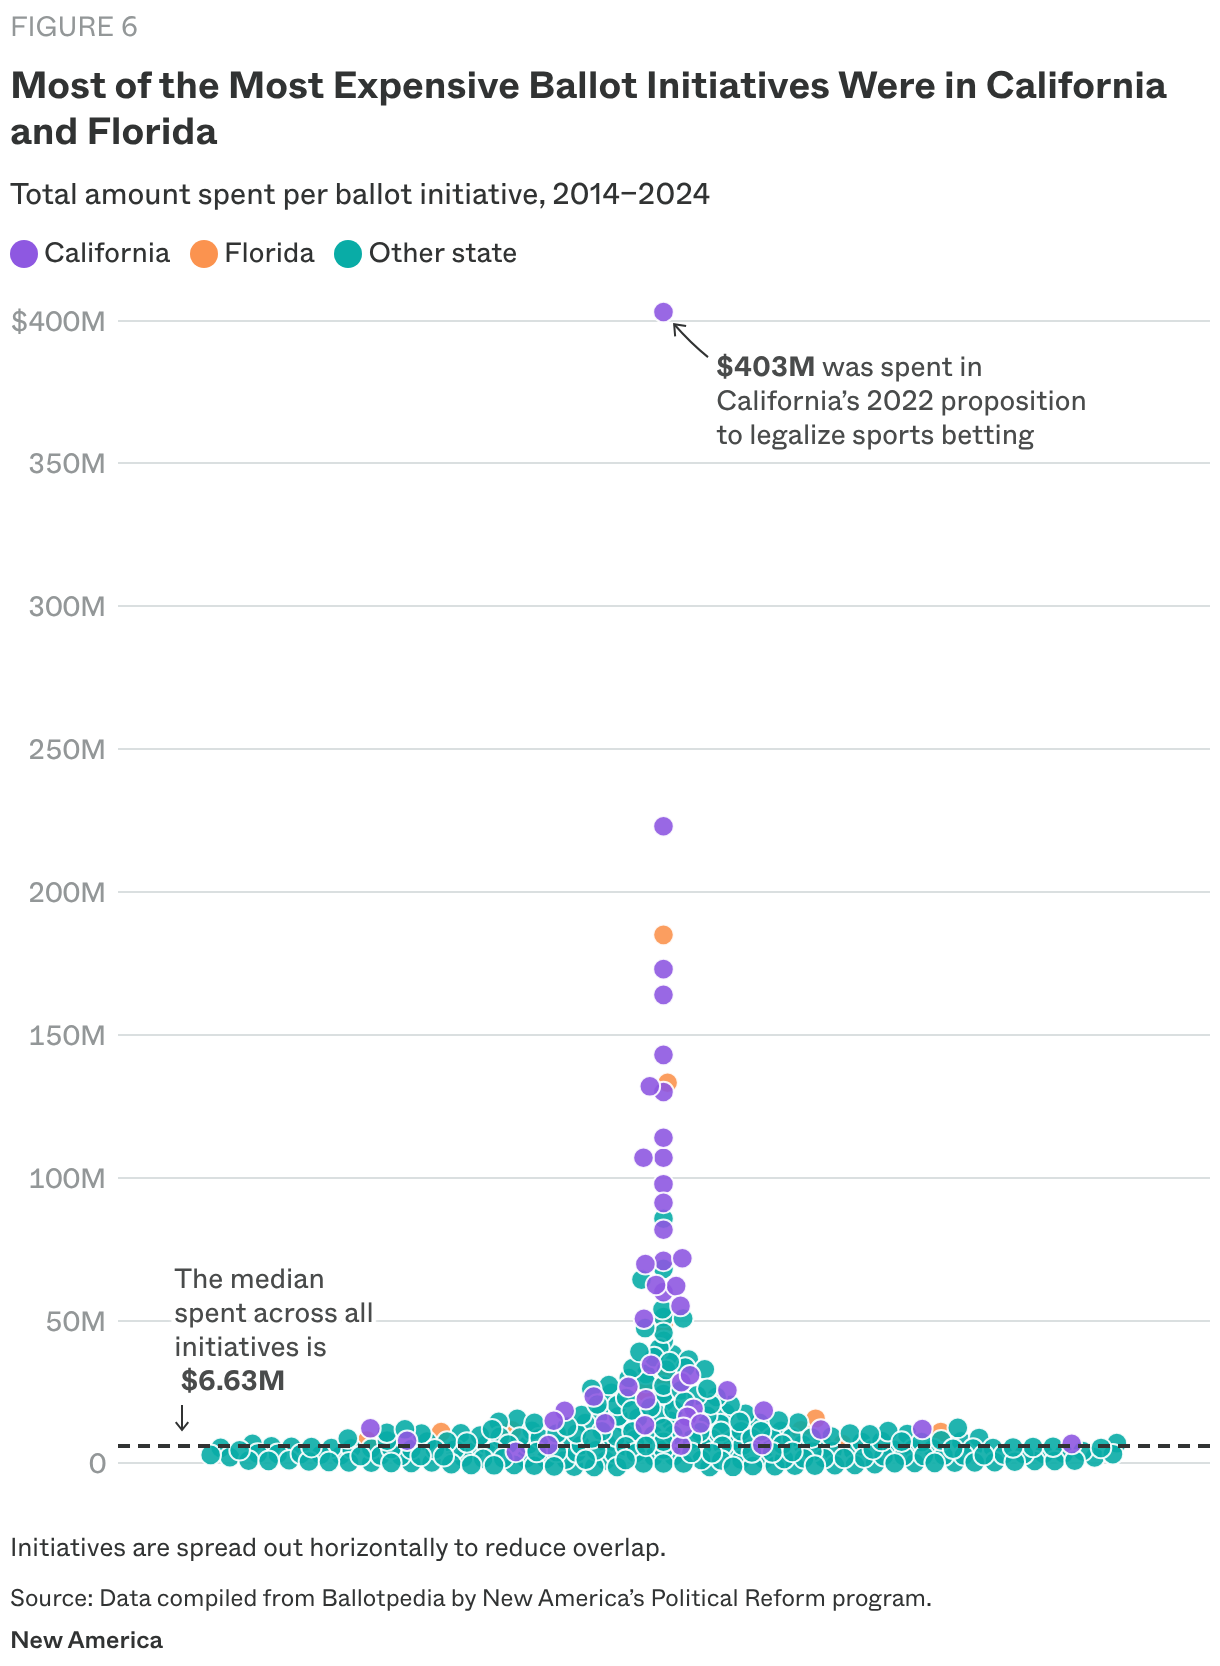
These campaigns fuel public perceptions of exorbitant spending on initiatives, but they are not representative of a typical campaign. Of the 318 individual ballot initiatives in our dataset, 29 measures (9 percent) had associated expenditures greater than $50 million, and 21 of these were in California and two in Florida.2 Florida, however, is also a case of how process choices and regulations impose financial barriers to initiatives and prevent initiatives from even seeing the light of day: The state only allows initiated constitutional amendments, requires at least 60 percent of the vote to pass measures, and recently implemented restrictions on petitioning so severe that zero initiatives qualified for the ballot in 2026. This is an example where, because of restrictions on the initiative process, we do not observe how much money would be spent on possible ballot initiatives, but if a ballot initiative does qualify, it would likely require huge amounts of money.
Median Spending by State
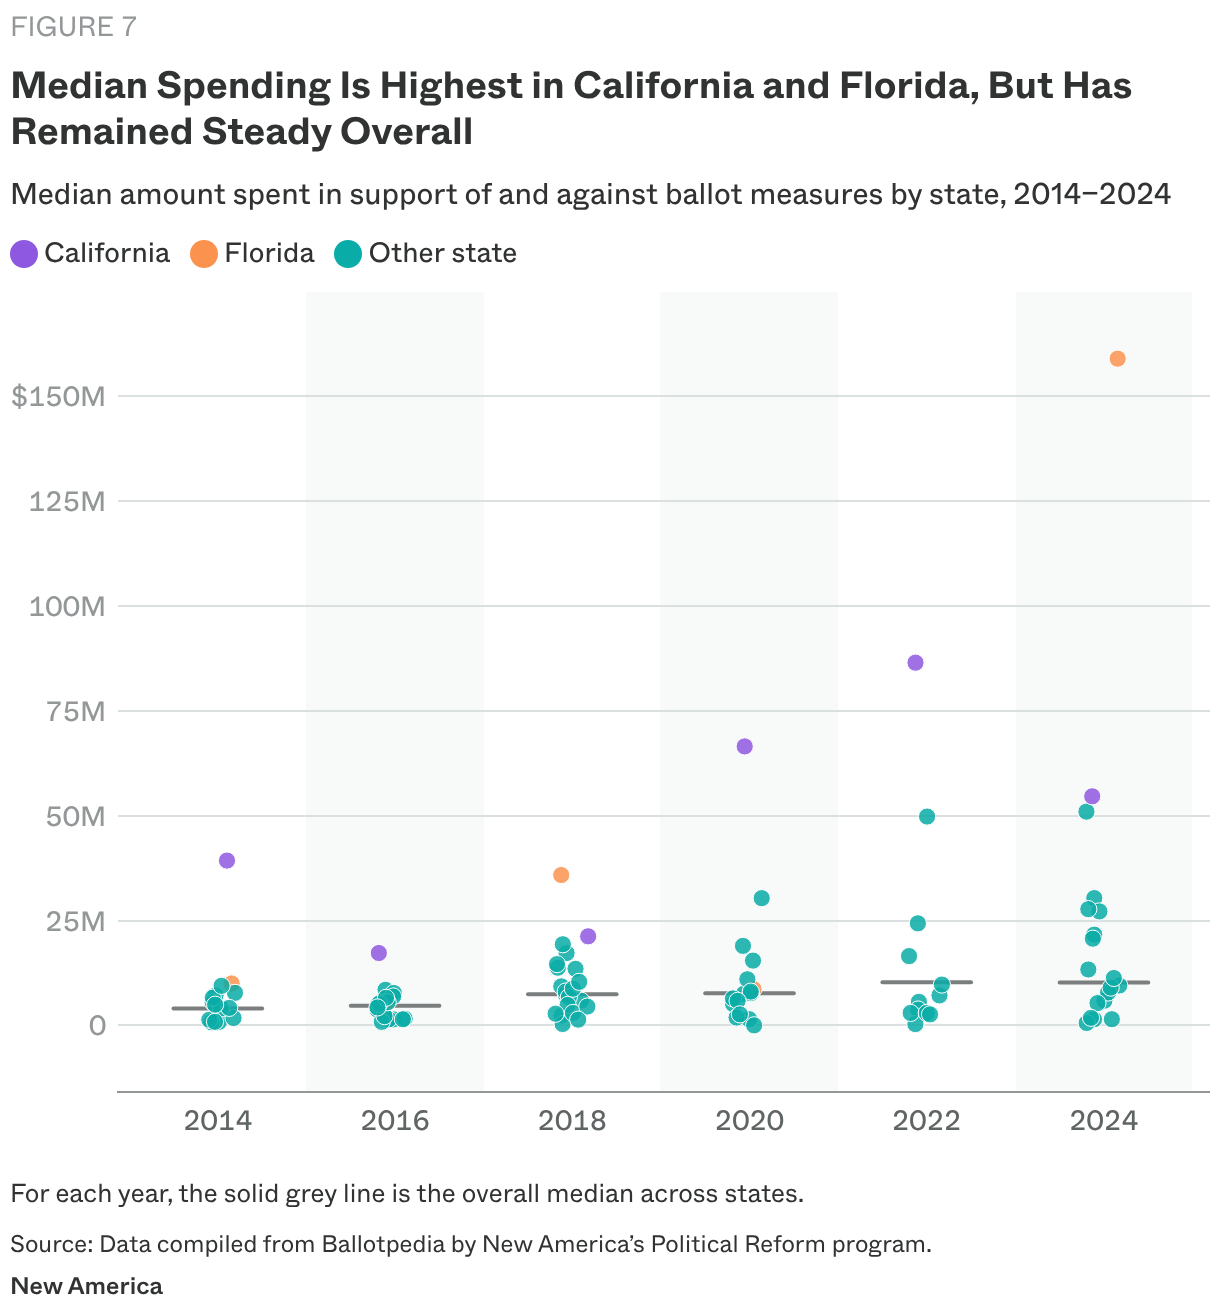
Figure 7 shows the median amount of dollars spent on initiatives per year in each state. We report medians since massive spending on a few initiatives severely skews averages. The figure shows that in every even-numbered year from 2014 through 2024, California or Florida has the highest median spending on ballot initiatives, often by a large margin. Over this time period, median spending on initiatives across all states was $6.63 million, and this figure remained relatively stable between 2014 and 2024. In 2024, median overall spending on initiative campaigns was $10 million. Excluding California and Florida, it was $8 million.
Support Versus Opposition Spending
Breaking down total expenditures into support and opposition provides a clearer view of how and when money is deployed within initiative campaigns. Figure 8 plots expenditures made for and against specific initiatives between 2014 and 2024. Across cycles, there is a consistent pattern: Far more money is spent supporting ballot initiatives than opposing them. In 2024, for example, groups spent a total of $900 million supporting initiatives, compared to $362 million in opposition.聽
Part of the imbalance is structural. Proponents must bear the full lifecycle cost of an initiative campaign, whereas opposition campaigns are usually reactive. If opposition campaigns emerge at all, they do so later, once the measure has qualified and its likelihood of passage is clearer. This allows them to target spending more selectively and efficiently. But greater support spending can also reflect the types of policies that make it to the ballot. Many initiatives concern issues with broad support, such as minimum wage increases and expanding access to health care. These measures still often require substantial investment to qualify and communicate with voters, but they don鈥檛 always generate equally well-funded opposition. As a result, support spending can dominate total expenditures even when outcomes are not closely contested.
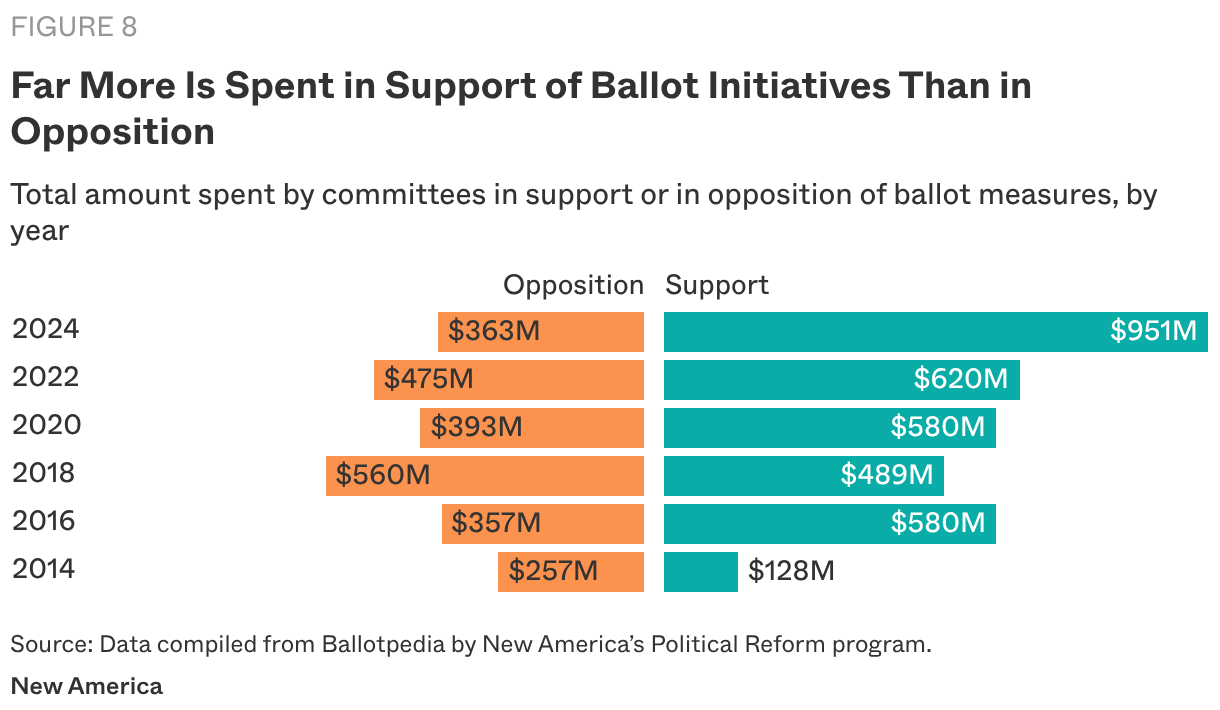
In the period from 2014 through 2024, the most expensive support campaigns were California鈥檚 2020 Proposition 22 ($204 million, with sizeable donations from companies like Uber, DoorDash, and Lyft); California鈥檚 2022 Proposition 27 ($164 million in support of legalizing sports betting); and Florida鈥檚 Amendment 3 to legalize marijuana in 2024 ($154 million). Meanwhile, the largest opposition campaigns were California鈥檚 2024 Proposition 27 ($239 million) and, in a distant second place, California鈥檚 Proposition 61 in 2016 ($111 million, in opposition to the Drug Price Standards Initiative).聽
Again, most campaigns fell well below topline spending levels. As shown in Table 1, of the 288 unique initiatives we analyzed (excluding initiatives for which we identified one committee contributing to multiple campaigns to avoid double-counting), 72 percent spent less than $10 million, 55 percent spent less than $5 million, and 23 percent spent less than $1 million. The comparable figures for opposition spending were 83 percent, 74 percent, and 57 percent, respectively.
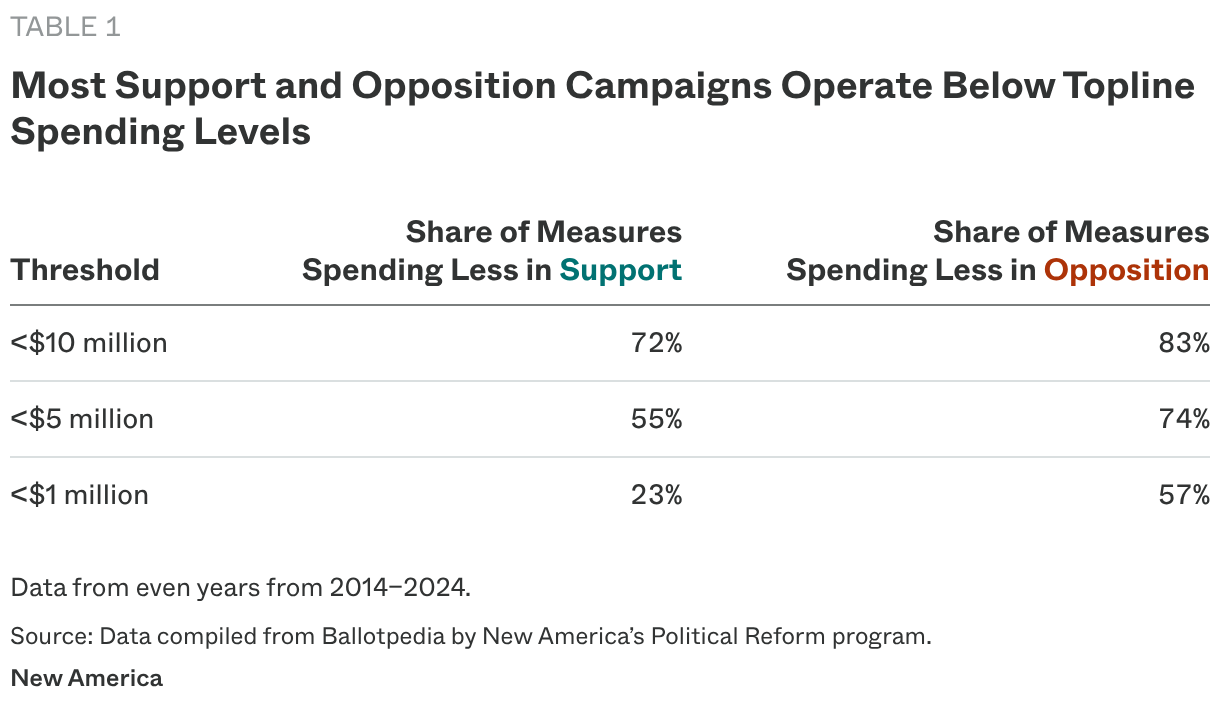
These figures emphasize multiple recurring themes: Spending is geographically concentrated in a few high-profile campaigns, particularly in California and, recently, in Florida; and support spending usually exceeds opposition spending. For advocacy organizations, this data provides realistic benchmarks for estimating campaign costs and assessing the financial risk of pursuing an initiative strategy. For stakeholders in states without an initiative process, these numbers can help ground debates over whether to adopt a process in typical spending patterns rather than extreme outliers.

Citations
- Only a handful of states put initiatives on the ballot during odd-year elections. This can distort the analysis of trends over the years, so we focus on even-year races.
- One committee can contribute to multiple campaigns, but it is difficult to disentangle exactly how much goes to each individual campaign, and sources like Ballotpedia report the same amount for each different campaign. For example, in 2024, the same committees contributed to Montana鈥檚 Top-4 Primary Initiative and to the Majority Vote Required to Win Elections Initiative, and Ballotpedia reports the same amount of contributions for each. To avoid double-counting these amounts, we take into account only contributions to one of the initiatives when reporting aggregate measures, but we report each initiative鈥檚 contributions when reporting amounts for individual measures.