Alyson Silkowski
Senior Policy Advisor, New Practice Lab

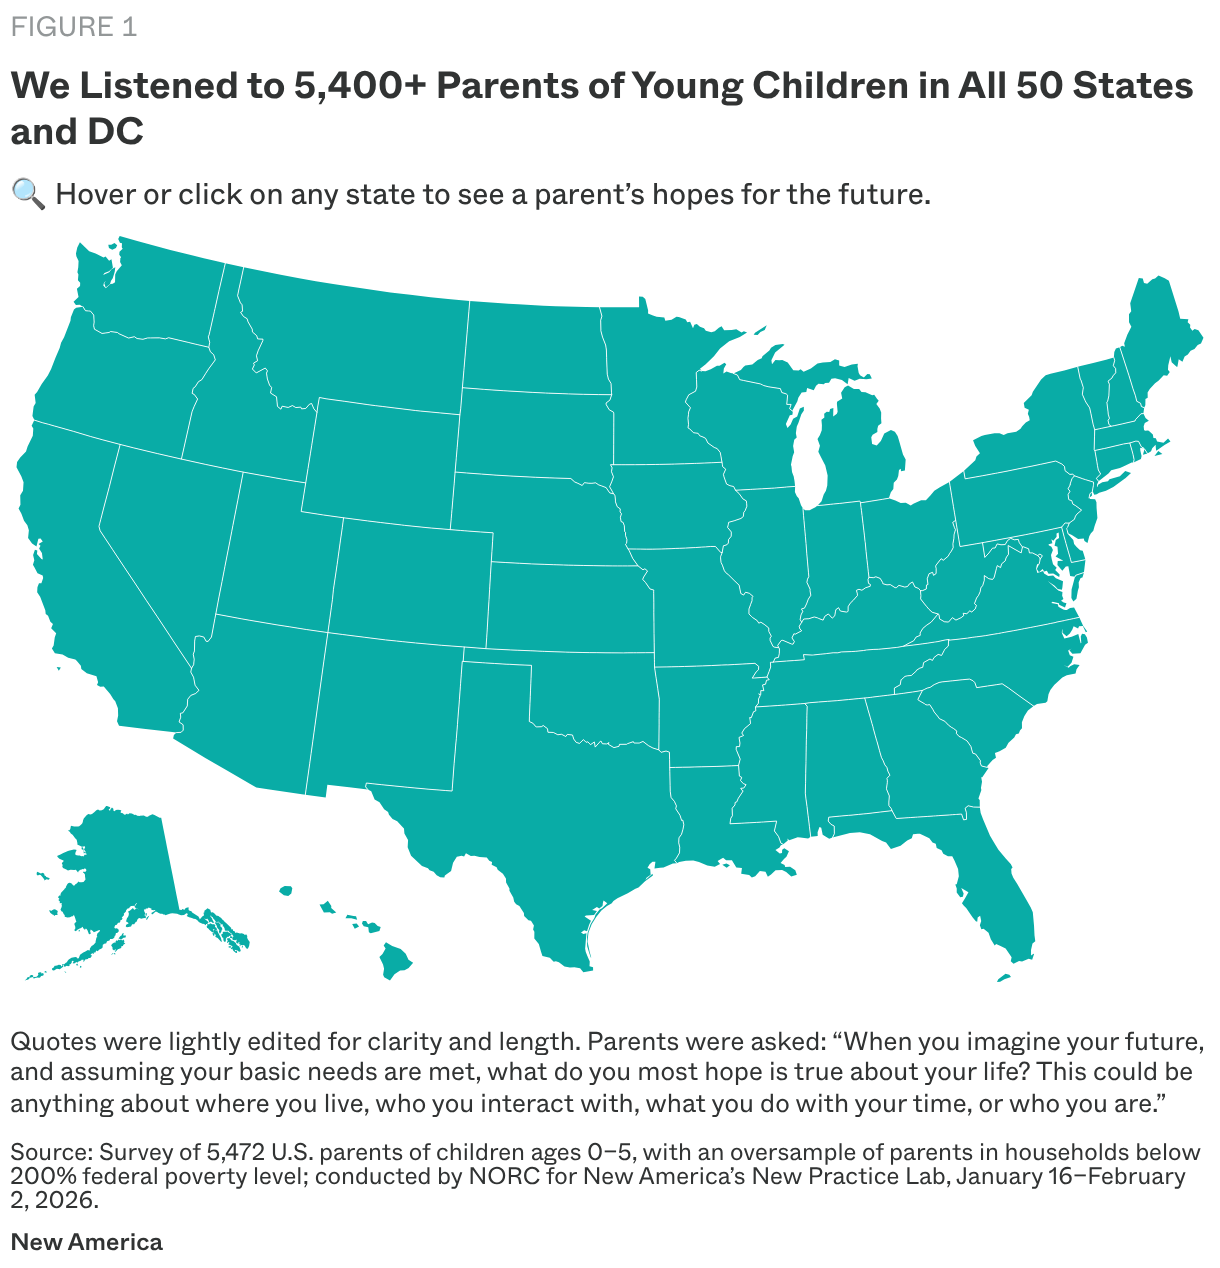
The 2026 National Parent Survey is the largest-of-its-kind, point-in-time nongovernmental survey of U.S. parents with young children under age six. At the New Practice Lab, we believe families know a great deal about what they need, yet governments rarely ask families what they actually want. How might public policies shift if they were informed by listening to families?
Reflecting the voices of nearly 5,500 parents from every state, including nearly 3,000 parents in lower-income households, the 2026 National Parent Survey presents a snapshot of what it is like to raise young children in the United States today.
This survey underscored how finite and precious time is. The New Practice Lab extends deep thanks to the thousands of parents who took the time to respond to the survey and share their experiences. We are especially grateful to the parents who tested the draft survey early on, whose feedback meaningfully strengthened the final instrument, and to the parents who participated in post-survey feedback sessions, whose insights helped us better interpret and refine the findings.
In recent years, politicians have proposed sweeping policies to ŌĆ£help families.ŌĆØ Yet, the one thing most of them havenŌĆÖt done is listen, deeply and without agenda. The result is a growing gap between the way America builds policies for families and the things those families actually say they need.
The New Practice Lab aims to close that gapŌĆöfirst, by listening deeply to families, and second, by working responsively to improve the policies and practices that serve them. Over the past three years, our work has helped to improve public benefits for 2.8 million people, nearly 1 million of whom live in low-income families.
The more we learned from families in that work, the more their voices led us beyond our initial program-oriented questions. Family life came to feel less and less reducible to the government-speak with which we had grown accustomed to discussing it. The need for a new approach grew glaring.╠²
As the largest point-in-time, nongovernmental survey of parents of young children, the 2026 National Parent Survey sought merely to listenŌĆönot to poll-test pre-prescribed solutions, but to understand families on their own terms. It asked parents directly: What do you really want your life to look like?

The 2026 National Parent Survey sought merely to listenŌĆönot to poll-test pre-prescribed solutions, but to understand families on their own terms.
The answers are remarkably straightforward.
Parents in America want time. They want flexibility. They want to be genuinely presentŌĆöfor bedtimes and mealtimes, for unplanned afternoons, for the kind of play that doesnŌĆÖt fit on a calendar. They want child care arrangements and vacations that donŌĆÖt require logistical or financial miracles. They want to get outside and share new experiences with their kids. They want to spend their childrenŌĆÖs earliest and most magical years in wonder, not consumed by the fear that itŌĆÖs all going to fall apart.
But parents today navigate a different world than the one their own parents knew. now grow up in households where all parents workŌĆöyet the way we support working families has barely changed at all. The workday bleeds into the evening. Screen time threatens dinner time. ŌĆ£Dynamic schedulingŌĆØ upends family routines and stable earnings. Many parents told us they have less margin, and less certainty, than ever.
These challenges belong not only to women, nor to families of high or low income. They are systemic, and they affect everyone. To be sure, the data show profound differences along lines of gender, race, place, and income, but parents of every stripe and circumstance want more choiceŌĆömore agency and better supportŌĆöin how they show up for their families.
For too long, our country has offered families oversimplified choices about how to raise children and what support they need. This data tells a different storyŌĆöone of enormous common ground, and a genuine hunger for more creative, flexible solutions. We hope that by sharing what parents actually said, we can help build policies that are worthy of the lives they are working so hard to live.
ŌĆöTara Dawson McGuinness, Founder and Executive Director, New Practice Lab
The news today is full of stories about parents in crisis. The costs of raising a family, including everything from groceries and clothing to gas and electricity, are climbing across the country. Child care costs, already 10 percent of a married-couple familyŌĆÖs average annual income and 33 percent of a single parentŌĆÖs income, continue to rise.1 Median rent is close to $2,000 per month.2 And inflation remains high, making day-to-day expenses harder to afford.3 Families with children ages zero to five are stretched especially thin, more likely to live in poverty and engage multiple public systems at once. After having children, the average two-parent household experiences a 14 percent drop in income, while single parents, especially women, may have to withstand an up to 36 percent decrease.4 More than a year after the U.S. Surgeon General issued an advisory calling parental stress a public health crisis, headlines like are not uncommon.5
Politicians on both sides of the aisle are increasingly offering prescriptions for what they believe is ailing parents in the United States, from childrenŌĆÖs savings accounts to universal child care. But almost no one has asked parents with young children, directly and at scale, what they actually want their lives to look like. The New Practice Lab at ┬ķČ╣╣¹Č│┤½├Į now has.
At the beginning of 2026, the New Practice Lab fielded the largest-of-its-kind representative survey of U.S. parents with children under the age of sixŌĆöthe 2026 National Parent SurveyŌĆöhearing from 5,472 individual parents from every corner of the country.6 This included 2,915 parents with lower incomes, defined here as household income below 200 percent of the federal poverty level or just under $55,000 for a family of three (see the Appendix for full methodology).7╠²
Trained as designers, researchers, policy experts, data scientists, and technologists, the New Practice Lab works alongside government partners across the country to build and improve policies, public service delivery systems, and technologies to better support families with young children. This survey was inspired in part by in-depth conversations the New Practice Lab has had with parents over time through our , which underscored the layered and interdependent challenges that those raising young children, but especially those with the lowest incomes, are facing today. While our work is also informed by the many robust quantitative research efforts related to families that already exist, we aimed to focus on topics that are relatively less well-covered terrain.8 Rather than only probe the problems in parentsŌĆÖ lives as they are experienced today, we wanted to ask parents how they wish their lives looked in an effort to surface potentially new solutions. How do parents want to spend their time, and their childrenŌĆÖs time? What do they want their working lives to look like? What do they hope for in their futures?
Throughout this report, we elevate quotes from survey participants to highlight parentsŌĆÖ lived experiences and perspectives in their own words. Here is what they said.
The 2026 National Parent Survey is a nationally representative survey of parents of young children in the United States, conducted by the National Opinion Research Center (NORC) at the University of Chicago on behalf of ┬ķČ╣╣¹Č│┤½├ĮŌĆÖs New Practice Lab. This work was inspired by , and advances our work alongside government partners to build and improve policies, public service delivery systems, and technologies to better support families with young children. The survey asked parents about their current and ideal work, parental leave, and child care arrangements, as well as challenges and hopes raising children ages five and under.
respondents
parents below 200 percent FPL
oversample
of states reached, plus DC
When was it conducted? January 16ŌĆōFebruary 2, 2026
Who responded? The survey reached 5,472 parents and primary caregivers ages 18 or older with children ages zero to five, from all 50 states and the District of Columbia. Respondents reflected a broad range of ages, races and ethnicities, education levels, income levels, and family structures.
How was it conducted? The survey was completed primarily online, with a small number of phone interviews. It was available in both English and Spanish.
Is it nationally representative? Yes, the survey draws on NORCŌĆÖs AmeriSpeak┬« Panel, a probability-based panel designed to represent the U.S. household population. Results are weighted to reflect the national population of parents with young children. The survey intentionally oversampled parents in households with incomes below 200 percent of the federal poverty level (FPL) to ensure sufficient responses for analysis (which included 2,915 completed interviews).
What did the survey cover? The survey asked parents about their childrenŌĆÖs care arrangements and child care needs, employment and work changes since having children, household finances, parenting challenges, use of and preferences for parental leave, preferences on time use, and hopes for the future. Click used.
ŌĆ£I most hope that I would be able to spend more quality time with my family, especially my child. You only get one life, and I donŌĆÖt want to miss out on important family moments or take them for granted.ŌĆØ
ŌĆöMom of one, New York
In a cultural and political landscape so often characterized by division, the 2026 National Parent Survey suggests that parents with young children do share much in common. Two key themes emerged from the findings and were consistent across demographic groups: Parents want more quality time with their children, and money gets in the way of how parents want to spend their time.
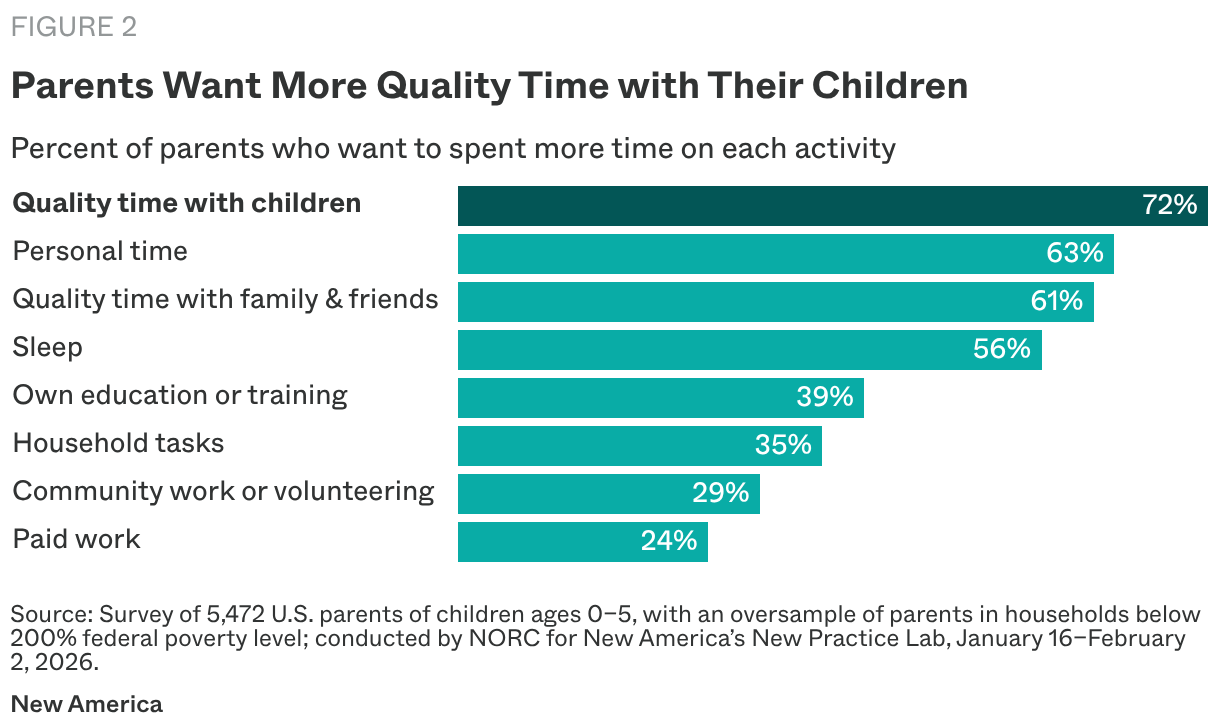
When asked whether they want to spend more, less, or about the same amount of time on a range of common activities, parents were most likely to say they wanted more quality time with their children. A majority of parentsŌĆö72 percent overall, or nearly three in fourŌĆöreport wanting more quality time with their children.╠²
ŌĆ£I would love to have more time playing with them than cleaning or cooking as soon as we get home.ŌĆØ
ŌĆöMom of two, Virginia
ŌĆ£I would definitely want to take them to the park to have a picnic. I also would love to play games with them more instead of focusing on housework and chores. I would love to sit and talk with them to hear about what they like/dislike and the person theyŌĆÖre becoming and growing into.ŌĆØ
ŌĆöMom of five, California
This desire for more quality time with children is universal, and it holds true across income groups, geography, and race and ethnicity. Rates are also similar regardless of gender, with 74 percent of dads and 71 percent of moms wanting more quality time. As shown in Figure 2, the other activities parents wanted more time on were personal time (63 percent), quality time with other family and friends (61 percent), and sleep (56 percent). A minority of parents report wanting to spend more time on household tasks (35 percent), community work or volunteering (29 percent), and paid work (24 percent).
When parents imagine what they would do with more time with their children, the most common answers were playing, enjoying outdoor activities, and traveling. Overall, about one in five parents (19 percent) said they would like to play if they had more time with their children, while 15 percent of parents mentioned spending time outside together, and 14 percent of parents said they would like to travel or go on vacations. ParentsŌĆÖ responses to this question did differ by race. Black parents, for example, cited travel (23 percent) more often than play (11 percent).
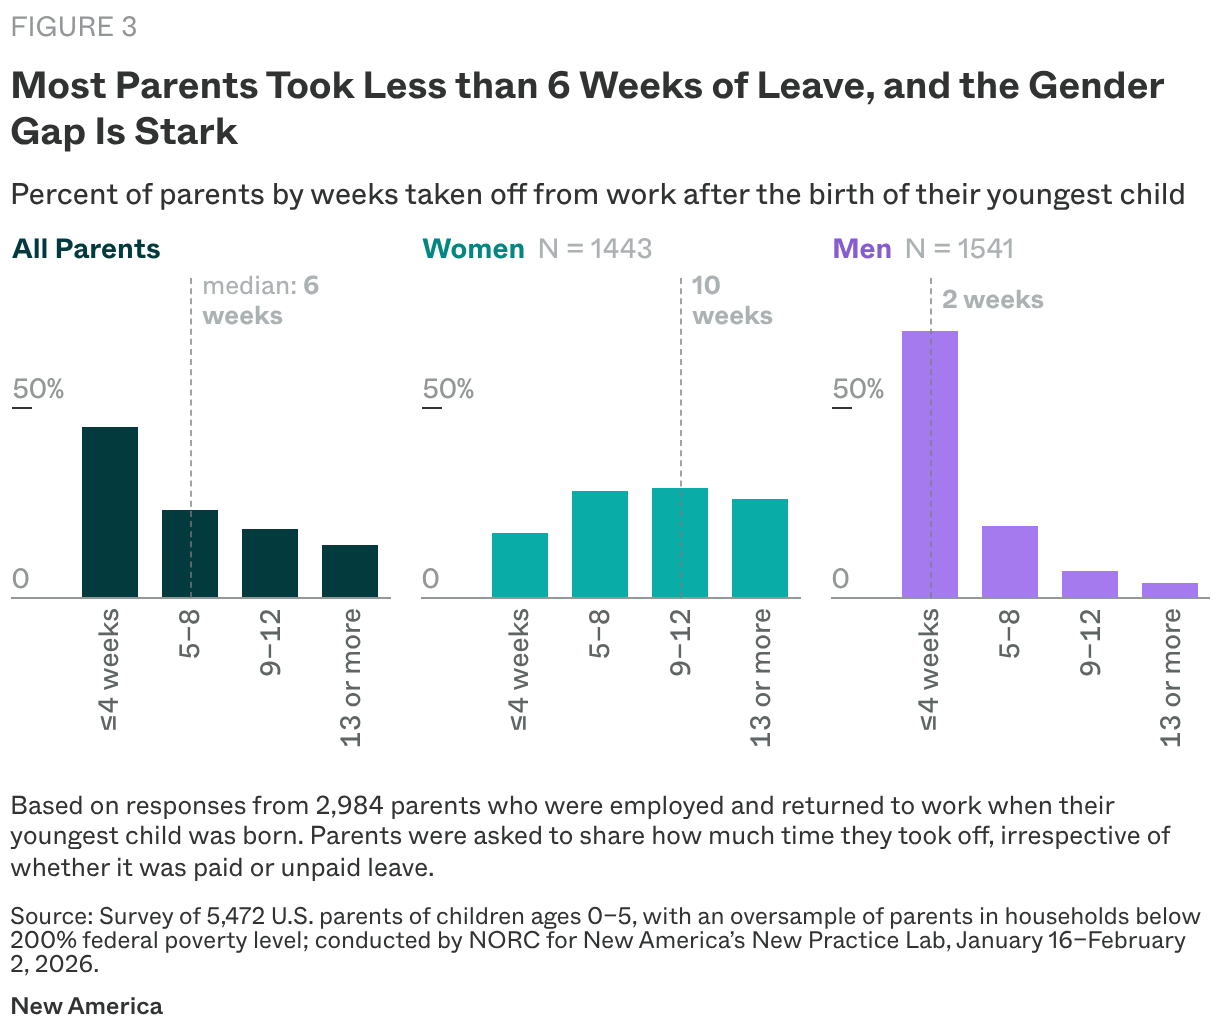
ParentsŌĆÖ time with their children is too short from the start. Among parents who were employed when their youngest child was born, 15 percent reported not taking any time off from work. Of those parents who did take time off and later returned to work, most (59 percent) took six weeks or lessŌĆöwhether paid or unpaid.1
ŌĆ£[The most challenging thing about being a parent of a young child is] the newborn stage, especially being a new dad.ŌĆØ
ŌĆöDad of three, Massachusetts
ŌĆ£[The most challenging thing about being a parent of a young child is] having to leave and return to work.ŌĆØ
ŌĆöMom of two, Iowa
Overall, 86 percent of parents took 12 weeks or less of leave. However, there are significant differences in leave-taking based on gender. When asked about their experiences of parental leave, dads who eventually returned to work reported taking far less leave than moms. The median leave for dads was two weeks, while the median leave for moms was 10 weeks. A large majority (70 percent) of dads took short leaves of four weeks or less. And few dads (11 percent) took longer leaves of nine weeks or more. In contrast, a small share of moms (17 percent) took short leaves of four weeks or less. Most moms who returned to work (55 percent) took more time off: 29 percent took nine to 12 weeks of leave, and another 26 percent took 13 or more weeks (see Figure 3).
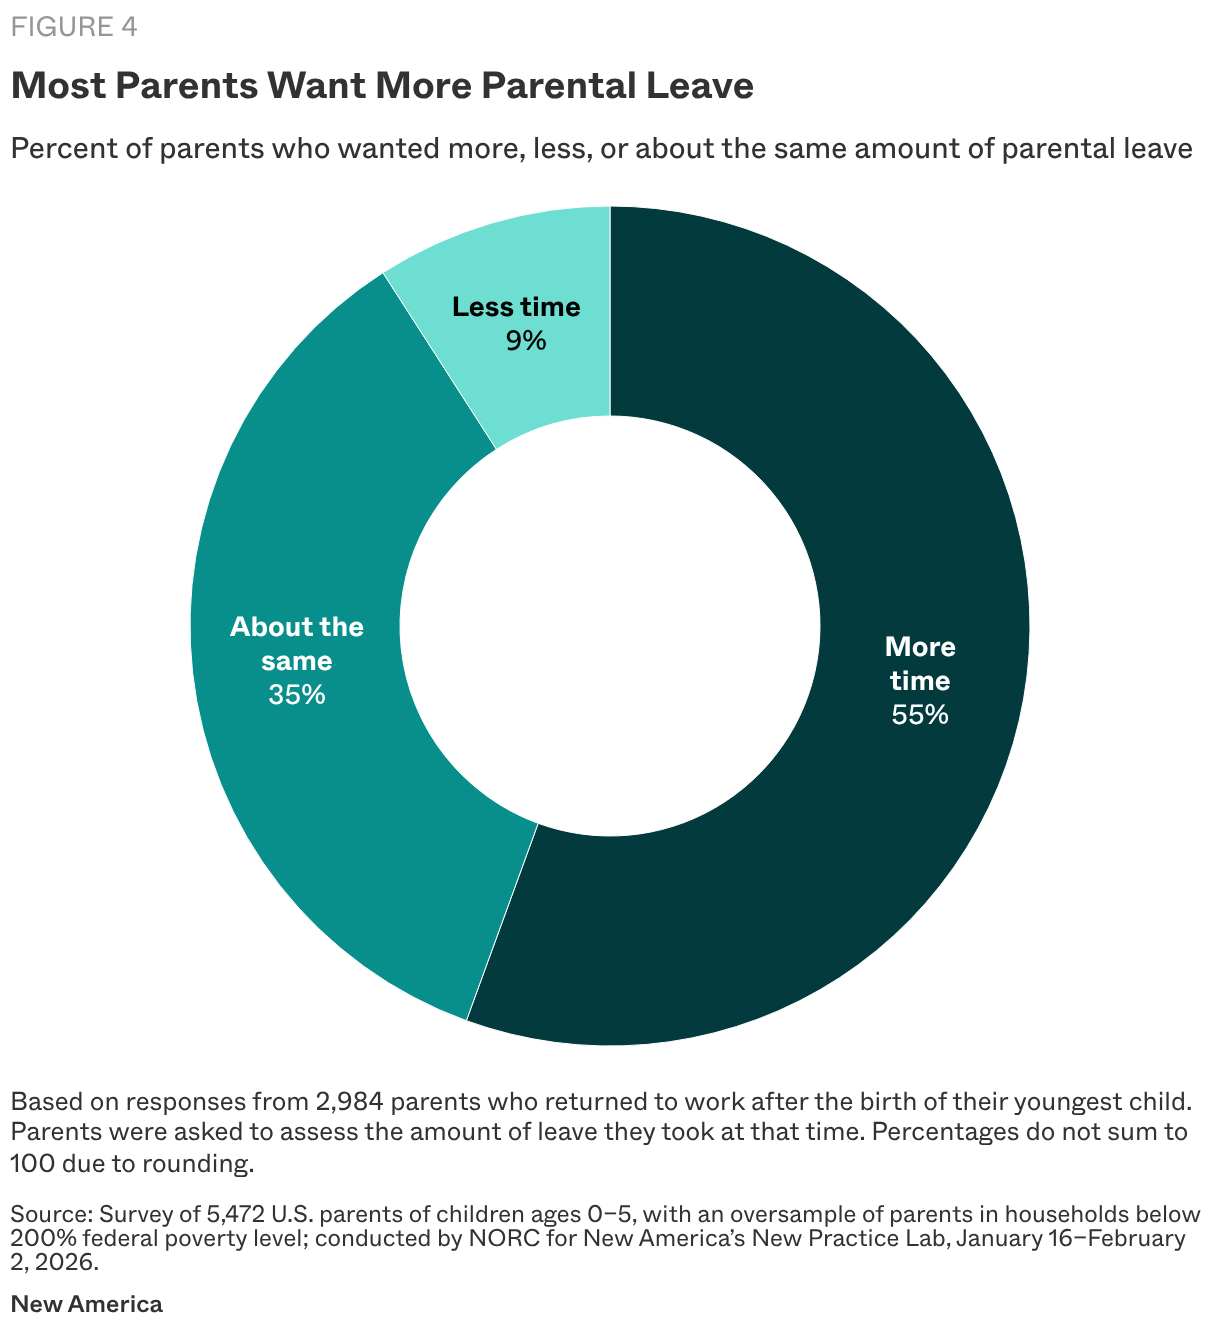
On average, parents are not satisfied with the amount of time they had to be with their children after they were born.2 A majority of parents (55 percent) described the amount of time as less than what they wanted, while a little more than a third of parents (35 percent) reported it was about the right amount of time for them (see Figure 4). When comparing parents by gender, most dads (52 percent) and moms (59 percent) said they had less time than they wanted. A majority of parents across income groups reported having less time than they wanted as well, with 52 percent of lower-income families (under 200 percent of the federal poverty level) indicating the time they had was too short. Of moderate- and higher-income families (at or above 200 percent of the federal poverty level), 56 percent noted the same.
When asked how much parental leave they would want if money were not a concern, 56 percent of parents reported wanting 11 or more weeks of leave or to not return to work at all. Roughly one in five (21 percent) parents would have liked more than 16 weeks off, or four months or more, before returning to work.
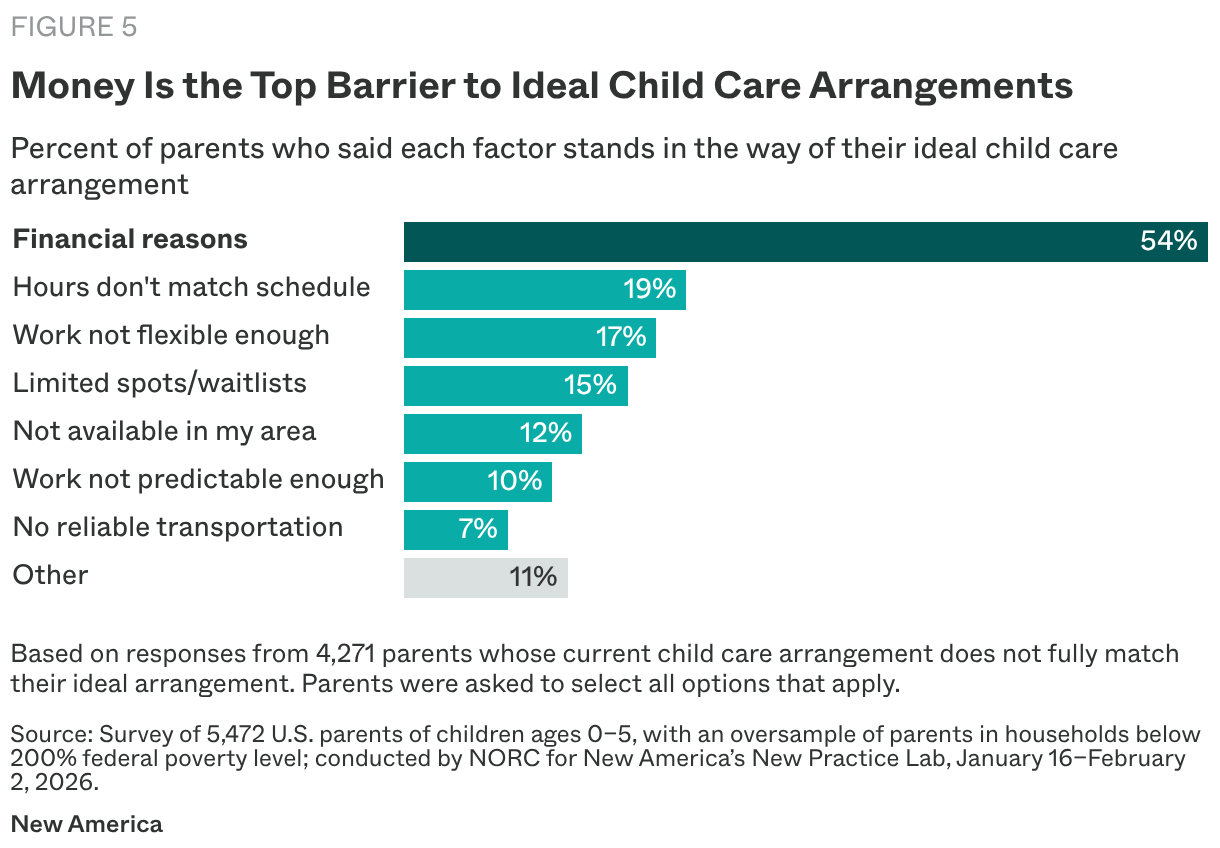
Financial concerns impact not only how much parents need to work but also the child care options available to them. Among parents with children under six who say their current child care arrangement falls short of their ideal child care setup, cost is the top barrier cited by more than half, or 54 percent, of parents (see Figure 5). The average cost of child care nationwide is indeed rising and outpacing inflation.3
ŌĆ£The most challenging thing about being a parent of a young child now is deciding if you can support your family off of one income, or for your entire paycheck to go to child care costs.ŌĆØ
ŌĆöMom of three, Oklahoma
But it is not only parents with child care bills whose choices are limited by money. Financial concerns are shared by parents for whom child care tuition fees are prohibitive, as well as parents who would prefer to provide child care for their children but note the forgone income such an arrangement requires. ┬ķČ╣╣¹Č│┤½├Į one in four parents facing a gap between their actual and ideal child care arrangement, cite supply or availability as a barrier.
When parents are asked what prevents them from spending time the way they want, such as having more quality time with their children, a majority of parents (52 percent) cite at least one financial barrier. The top two responses shared by families were related to affordability: 37 percent of parents say they cannot afford the activities that they would like to do with that time, and more than one in four parents (27 percent) say that they need to work more hours to support their household financially.
Concerns about money are broadly felt by parents regardless of income level. However, lower-income parents with children under six are more likely to report having taken on one or more additional jobs to supplement their income as a result of having young children: Nearly one in three parents (31 percent) with income below 200 percent of the federal poverty level are working more jobs now with young children, compared to nearly one in five (19 percent) parents with income at or above 200 percent of the federal poverty level.
Higher wages are the single most-requested change that parents say would improve their ability to have their ideal work situation, making it easier to manage their time, care for their families, and do more of what matters to them.
ŌĆ£I need to make more money in shorter hours to allow myself the freedom to spend more time with my family.ŌĆØ
ŌĆöMom of three, Pennsylvania
When asked which changes to their current work arrangement would help realize their ideal work life, parents most commonly cited pay, with two out of three (66 percent) reporting higher wages (see Figure 6a). Roughly half of all parents with young children noted that the ability to work from home or other locations (51 percent); more flexibility, such as to care for a sick child or go to an appointment (49 percent); and better access to benefits (48 percent) would also help a lot.
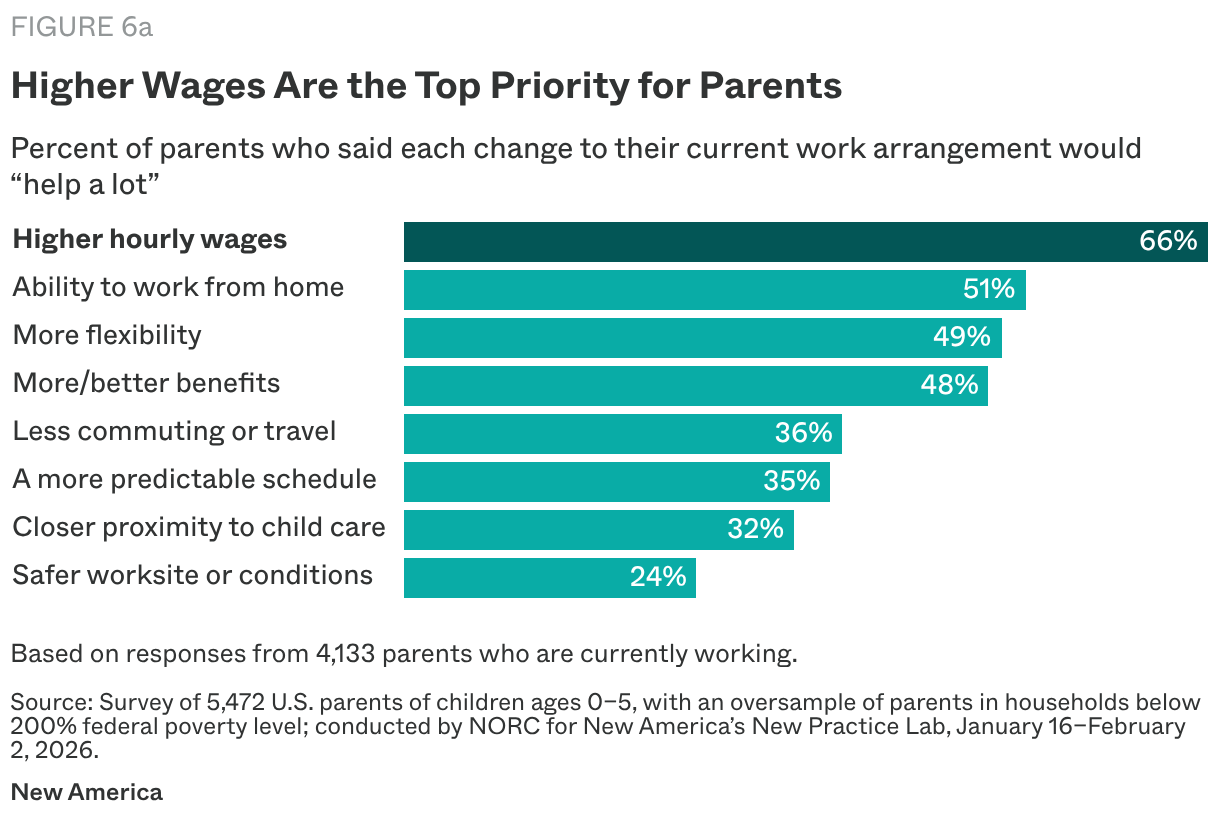
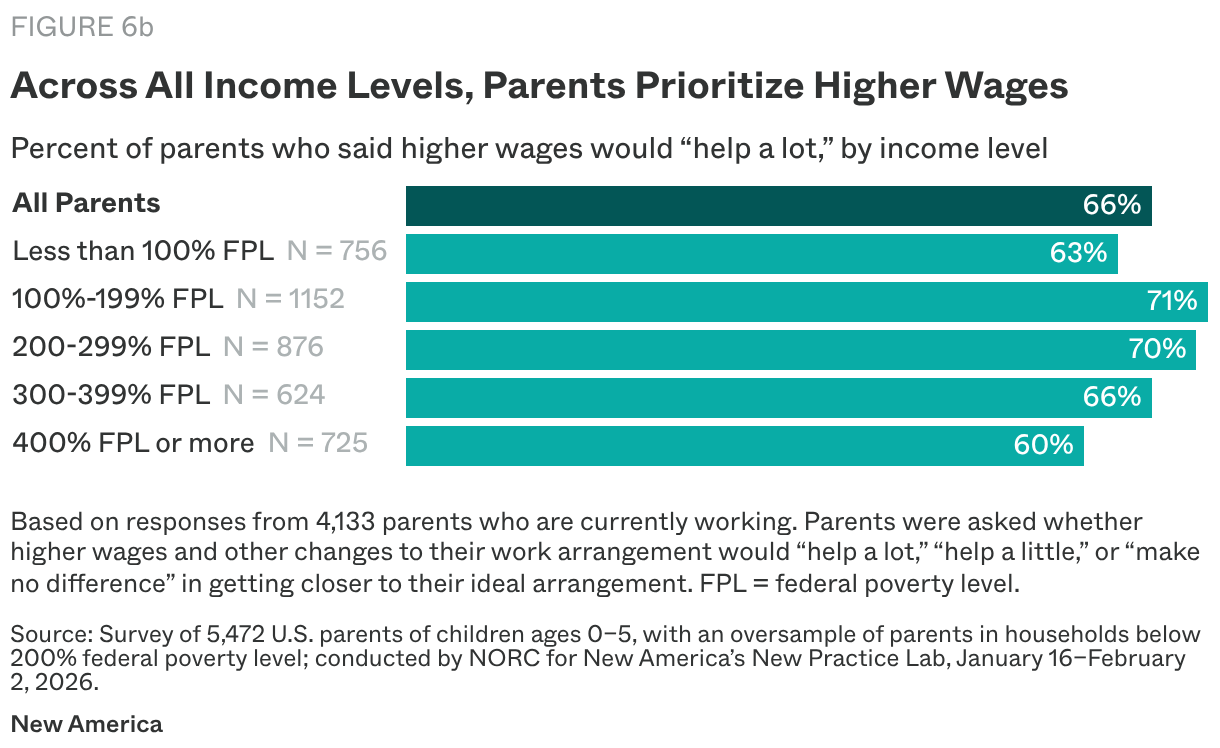
Higher wages topped the list for parents regardless of gender, race and ethnicity, geographic location, or income. Indeed, despite a significant difference in household incomeŌĆöbetween parents making less than 100 percent of the federal poverty level and those at 400 percent or more, representing at minimum an annual difference of about $82,000 per year for a family of three4ŌĆöroughly the same share of parents on both ends of the income spectrum noted higher wages would help a lot (see Figure 6b).
ŌĆ£The most challenging thing is making sure you are making the best choices for [your] childŌĆÖs future.ŌĆØ
ŌĆöMom of two, Arkansas
While the vast majority of parents with children under six years old want more time with their children and need money to get there, there is no single way parents would choose to restructure their working lives, their childrenŌĆÖs care, or their family time to achieve this. The 2026 National Parent Survey probed three issues at the core of how parentsŌĆÖ time is spent when their children are young: parental leave following the arrival of a new child, work arrangements, and child care.
What emerged is that preferences remain largely heterogeneous, with no one setup commanding a majority of parents across the country. Specific preferences also vary, at times significantly, by gender, parentsŌĆÖ existing work schedules, race and ethnicity, income, geography, and their childrenŌĆÖs age. The following section presents a selection of findings that stood out for notable gaps across demographic lines.
In addition to having less parental leave than they want, a majority of parents report that they do not currently have their preferred work or child care arrangement.
ŌĆ£I just want to feel safe and comfortable with our wages but be able to provide a life for our daughter where she is with us or friends/family more than child care. I donŌĆÖt want to only see my child in the mornings, nights, and weekends.ŌĆØ
ŌĆöMom of one, North Carolina
ŌĆ£T│¾▓╣│┘ I can protect my babies and still have the career I want.ŌĆØ
ŌĆöMom of one, Texas
ŌĆ£I canŌĆÖt work jobs IŌĆÖm interested or qualified in because the hours are too taxing. I want to be there with my children to raise them and enjoy each stage. My field doesnŌĆÖt offer much part-time work.ŌĆØ
ŌĆöMom of two, Tennessee
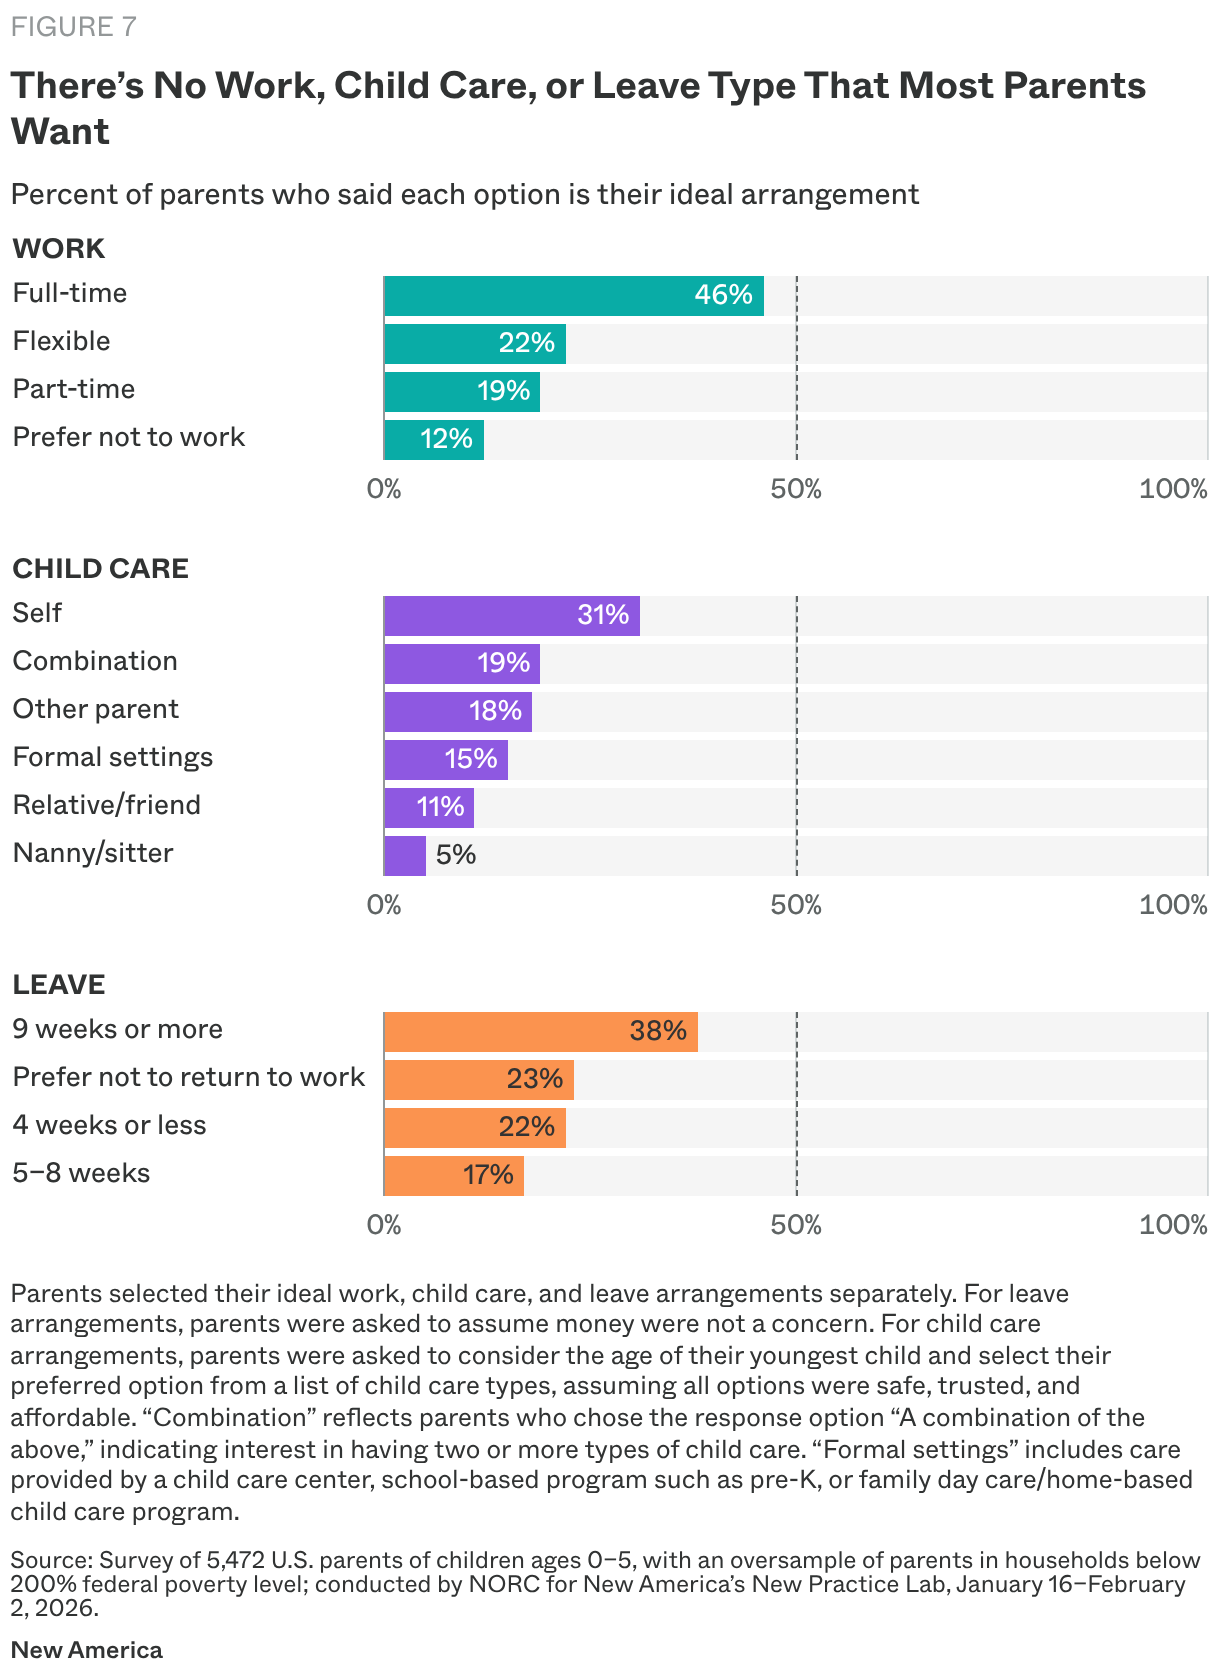
However, no single preferred work schedule is chosen by more than 46 percent of parents, no single child care arrangement by more than 31 percent, and no single leave duration by more than 38 percent, suggesting that parentsŌĆÖ needs are genuinely plural (see Figure 7).
Most parents with young children in the United States are not working the way they want toŌĆöand what they want varies. While nearly nine in 10 parents (88 percent) report wanting to work5 some amount, including a majority of both dads (91 percent) and moms (85 percent), 75 percent of parents say their current work arrangement does not fully match their ideal scenario.
ŌĆ£I want to be able to provide for my family and make sure they are safe and happy.ŌĆØ
ŌĆöDad of three, Michigan
ŌĆ£I spent many years getting my degree, and now I feel a sense of guilt and pressure to use it, even though ideally IŌĆÖd just be a stay-at-home mom entirely.ŌĆØ
ŌĆöMom of one, Maryland
ŌĆ£I just want to be a stay-at-home [parent]. I just like it more.ŌĆØ
ŌĆöDad of two, Texas
This gap reflects, in part, notable differences in preferred work schedules, which also diverge along gender lines. Among dads with children under age six, roughly two in three (64 percent) say they want full-time work, while only 30 percent of moms with children under six doŌĆöa 34-point gap (see Figure 8). Compared to dads, moms are more likely to say they would prefer part-time or flexible work.
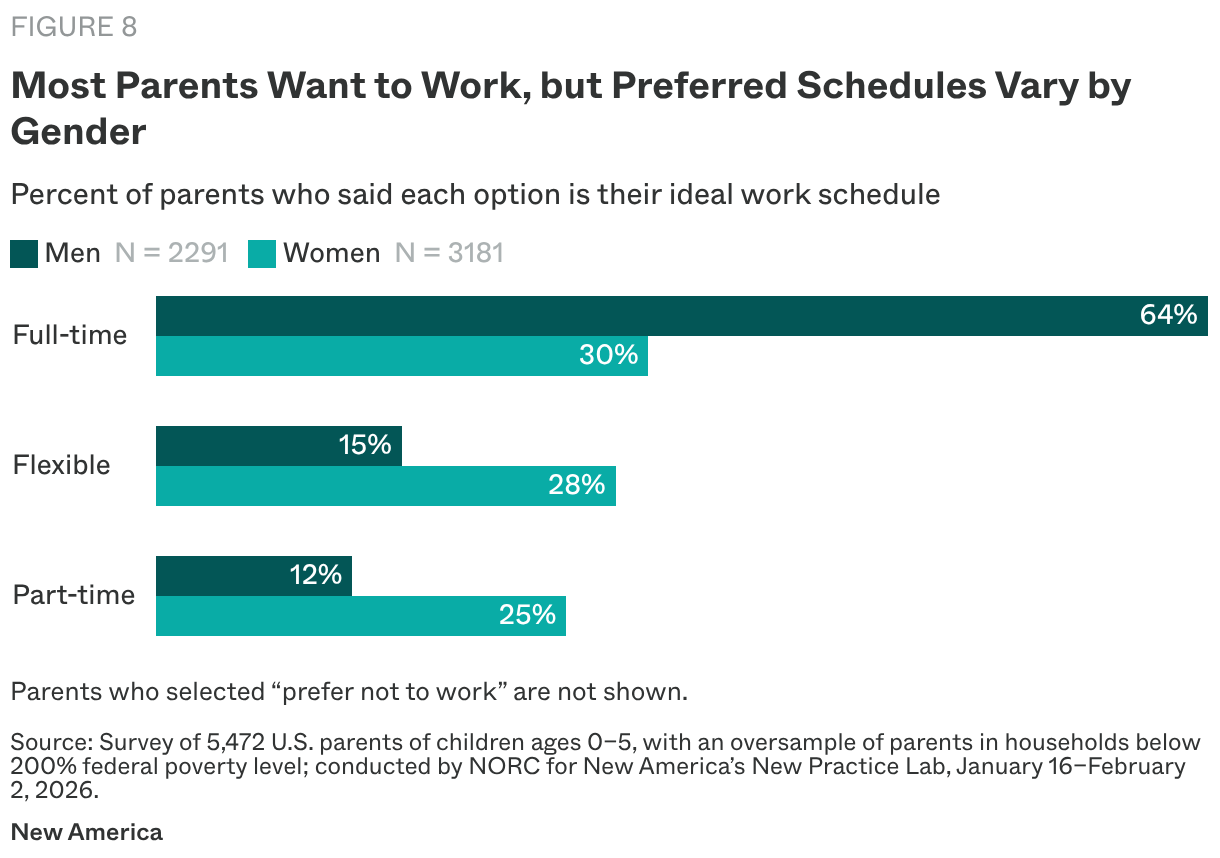
Even among parents with young children who reported working full-time today,6 their preferences for work arrangements vary: Half (50 percent) of moms say their ideal scenario would be to keep working full-time, while 22 percent would prefer a part-time schedule, and 17 percent favor flexible or as-needed work. A small minority (11 percent) would prefer not to work at all. And among dads working full-time, 71 percent say their ideal scenario would be to keep working full-time, while 12 percent would prefer a flexible or as-needed schedule. Almost one out of 10 dads (9 percent) would prefer part-time work, and 7 percent would prefer not to work at all.╠²
Although parents were not asked directly about job satisfaction, they were asked how closely their actual work arrangement matches their ideal arrangement. Those reporting a strong match were twice as likely to say they would prefer a full-time schedule, while those reporting a greater mismatch were twice as likely to prefer a part-time or flexible one. The type of work schedule parents want also varies by the predictability of their current jobs: Among parents with regular, consistent schedules, a majority (56 percent) favor full-time workŌĆöbut that figure drops to only 35 percent for those with rotating or variable schedules.
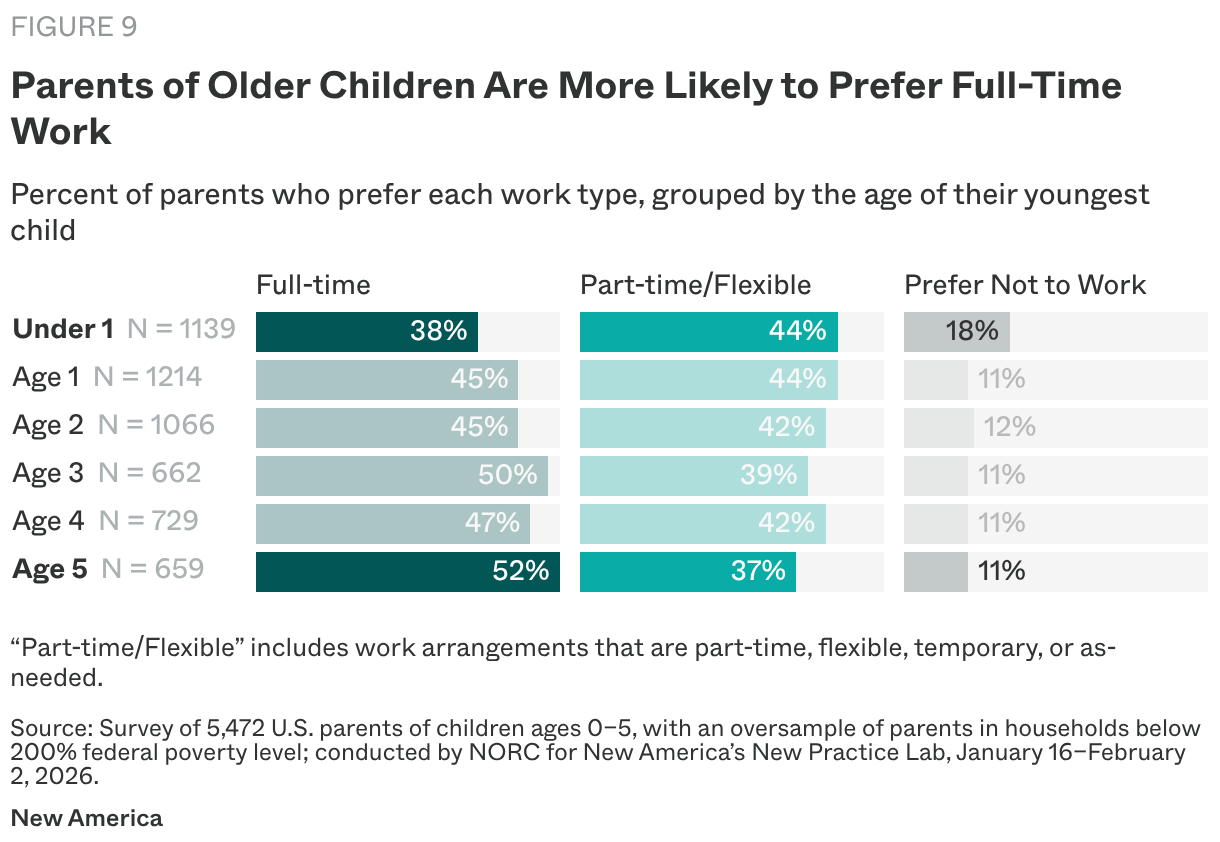
A childŌĆÖs age is also associated with how much parents want to work. Overall, parents whose youngest child is between the ages of one and five are significantly more likely to prefer full-time work than parents with infants under one. Parents with infants under one are more likely to prefer not to work than parents with older children (see Figure 9). This difference is driven largely by moms, whose preference for full-time work rises by 13 percentage points between having an infant and a five-year-old, compared to an increase of 6 percentage points among dads over the same time period.7
ParentsŌĆÖ ideal child care arrangements are not static; they shift meaningfully as their children age. Preference for a parent to be a childŌĆÖs primary caregiver is strongest for those with infants and young toddlersŌĆöconsistent with the finding that parents also had less parental leave than they wantedŌĆöand declines as children approach traditional school age.╠²
ŌĆ£You want to be the best parent. You want to find reliable care for your child when itŌĆÖs time to head back to work. I wish it was more convenient and consistent child care.ŌĆØ
ŌĆöMom of three, North Carolina
ŌĆ£[The most challenging thing about being a parent of a young child is] the unavailability of all-day 4K [four-year-old kindergarten] in the public school system.ŌĆØ
ŌĆöDad of two, Wisconsin
ŌĆ£I donŌĆÖt trust just anyone to care for my child.ŌĆØ
ŌĆöMom of one, California
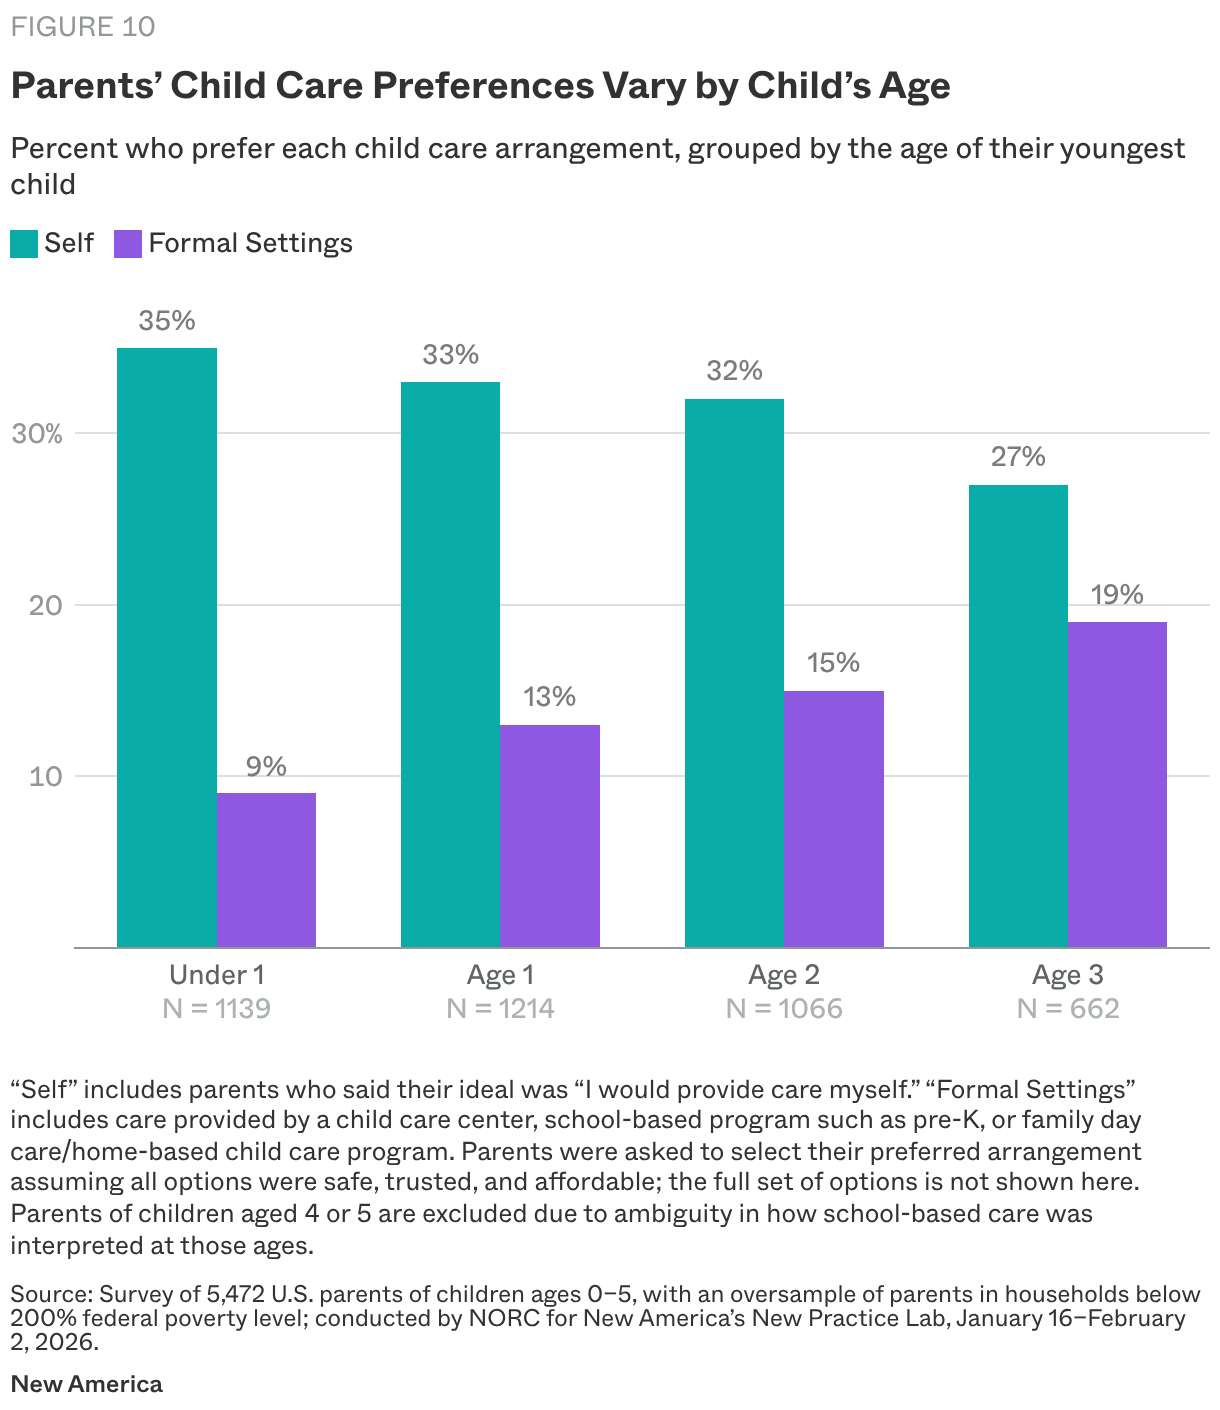
Among parents with a child under one, 35 percent say they would prefer to care for their child themselves, but that figure falls to 33, 32, and 27 percent, respectively, among parents with one-, two-, and three-year-old children (see Figure 10). More formal early childhood settings, such as family child care programs, child care centers, or school-based programs, are preferred by fewer than one in 10 parents with infants under one, but are a more common top choice among parents with toddlers.
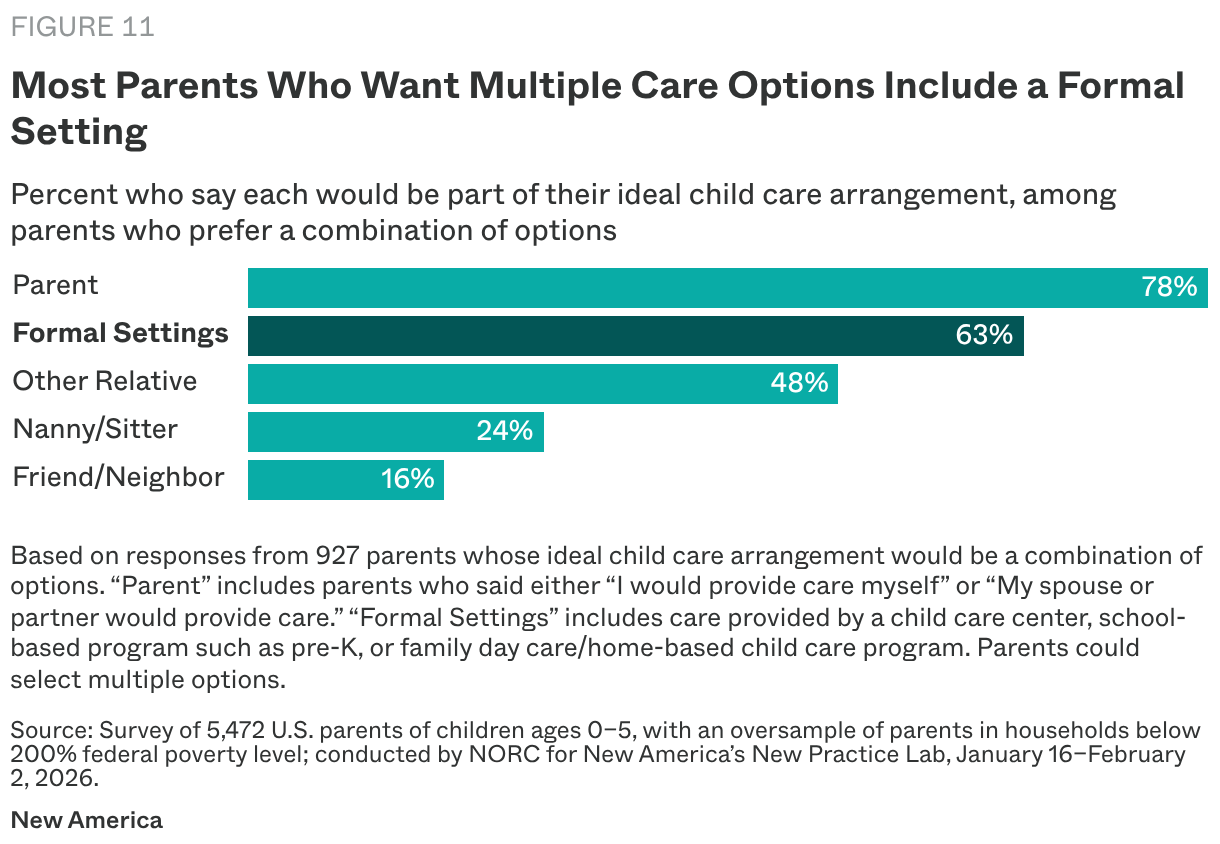
One in five parents overall would prefer access to a combination of child care arrangements (for example, where a child is cared for by a family member some of the time and also has access to and attends a child care center some of the time) rather than any one type. That preference is more common among parents whose youngest child is three years old than it is among parents of infants. Together, these findings indicate that as children grow, parents are more likely to seek formal child care settings, but some parents also desire flexibility rather than any single full-time option.8 Among all parents who said they would ideally use a combination of different child care arrangements, a majority (63 percent) would want their child to spend at least some time in a formal early childhood settingŌĆöeither a school-based program, child care center, or home-based child care program (see Figure 11).
While decades of research point to the benefits of high-quality early childhood settings for young children, particularly in closing gaps in school readiness, such settings remain inaccessible to the vast majority of families today.9 One recent study estimates that 4.2 million children do not have access to a formal child care setting in their community.10 For those who do, the cost of care can be prohibitive: As of 2025, the average price of child care nationwide was $13,184 per child, the equivalent of one-quarter of a family of threeŌĆÖs income at 200 percent of the federal poverty level.11 While we do not know how the preferences of U.S. parents with young children might change if high-quality, affordable formal child care options were more widely available, the survey suggests that many parents want more time to be with and provide care for their children in the earliest years of life.12 This is consistent with parentsŌĆÖ desire for more quality time with their children, broadly, and longer parental leave specifically.
ŌĆ£IŌĆÖm also a full-time student going for an associateŌĆÖs in IT. IŌĆÖm tired of being poor.ŌĆØ
ŌĆöMom of one, Pennsylvania
The topline findings of the 2026 National Parent Survey tell a compelling story about what parents of young children want (more time with children) and what is preventing them from realizing it (need for more income). But behind the overall figures are families whose lives are complex, with compounding constraints. For some, the gap between what they have and what they want is wider than for others. Put simply, familiesŌĆÖ needs and wants are not interchangeable. The average parent of a young child is facing real barriers, but the ŌĆ£averageŌĆØ masks the significant variation in how and to what extent those barriers get in the way for different families.
ParentsŌĆÖ familial responsibilities are not limited to raising young children. In fact, the 2026 National Parent Survey shows that 28 percent of parents with children under the age of sixŌĆöor more than 7 million AmericansŌĆöare also regularly providing care for an older adult family member.13 This dual caregiving role for parents (sometimes referred to as members of the ŌĆ£sandwich generationŌĆØ) puts added demands on their time and often their financial resources.
ŌĆ£Trying to parent [children] while taking care of a parent too is hard.ŌĆØ
ŌĆöMom of two, Virginia
ŌĆ£[My hope for my future is] that IŌĆÖm able to settle my mother and father in comfortable homes and take care of my children without worry.ŌĆØ
ŌĆöDad of one, Mississippi
Yet, this responsibility falls disproportionately on families already facing some of the greatest economic and structural challenges. More than one in three lower-income parents (36 percent) are regularly caring for at least one older adult, compared to one in four higher-income parents (25 percent). Additionally, Black and Hispanic parents are around twice as likely as white parents to be providing such care for an older adult. Parents living in cities are also more likely to have these additional caregiving responsibilities: 39 percent of urban parents with young children are ŌĆ£sandwichŌĆØ parents, compared with 25 percent of suburban parents, 25 percent of parents living in small towns, and 23 percent of rural parents.
While financial concerns are a common experience for parents of young children, how much families struggle and what that struggle looks like are uneven. Nearly four in 10 parents (39 percent) reported struggling to meet their familyŌĆÖs basic needs ŌĆ£oftenŌĆØ or ŌĆ£sometimesŌĆØ over the prior year. However, this figure jumps to two in three, or 66 percent, among the lowest-income parents (those with household income below 100 percent of the federal poverty level), compared to one in six, or 16 percent, among highest-income parents (those with household income at or above 400 percent of the federal poverty level). Overall, lower-income parents with young children are twice as likely as higher-income parents with young children to report having struggled to meet their familyŌĆÖs basic needs either ŌĆ£oftenŌĆØ or ŌĆ£sometimesŌĆØ over the prior year (61 percent compared to 30 percent).
ŌĆ£With the winter season here, itŌĆÖs concerning and more stressful now having a baby because IŌĆÖve got to make sure bills are paid so the heat in the house stays on. I now have to make sure my baby is okay and not too cold or getting sick.ŌĆØ
ŌĆöDad of one, Maryland
ŌĆ£I would spend more time outdoors with [my son]. I currently do not have a vehicle, so we can only spend time in our backyard most of the time.ŌĆØ
ŌĆöMom of one, Texas
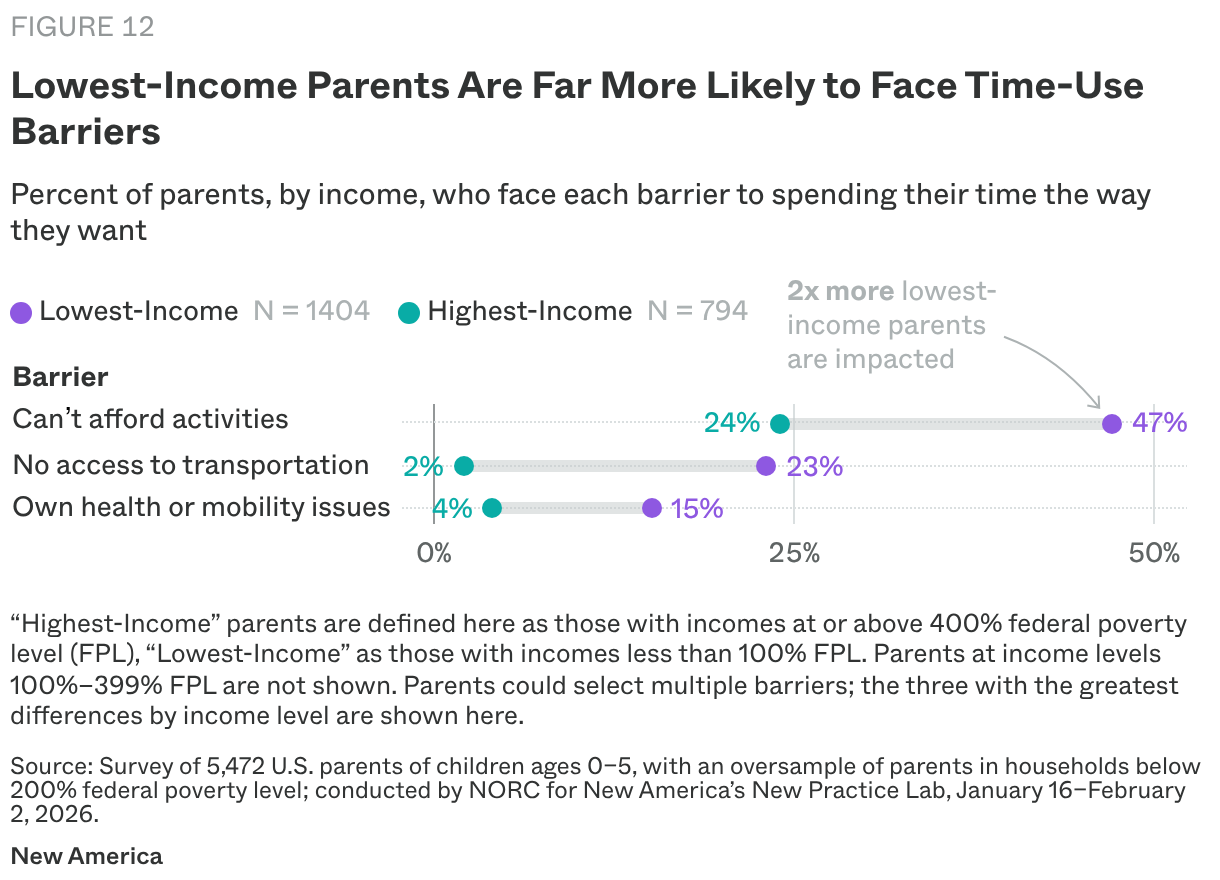
As the New Practice Lab has heard consistently from families participating in our Thriving Families initiative, lower-income parents face sharper trade-offs and fewer good options, and the 2026 National Parent Survey results underscore these dynamics. Nearly half of parents (47 percent) with income below 100 percent of the federal poverty level report that they cannot spend their time the way they would like because they simply cannot afford to (see Figure 12). Lower-income parents are also more likely to experience transportation issues with impacts to their time and access to child care. Nearly one in four (23 percent) of the lowest-income parents say a lack of transportation prevents them from spending their time the way they would like, compared to only 2 percent of the highest-income parents. Additionally, 23 percent of the lowest-income parents cite transportation as an obstacle to having their ideal child care, compared to only 2 percent of the highest-income parents.
Lowest-income parents are also more likely to say that health or mobility issues prevent them from spending their time how they would want; 15 percent of the lowest-income parents cited this compared to just 4 percent of the highest-income parents.
Lower-income parents are also more likely to have to adapt in ways that parents in better-resourced households do not. As one example, one in four (24 percent) working lower-income parents reported shifting to gig or platform-based work (such as delivery or rideshare jobs), for greater flexibility, compared to one in 10 higher-income parents.14 Working lower-income parents are also more than twice as likely as higher-income parents (20 percent versus 8 percent) to say they lost a job as a result of having young children, underscoring the outsized fragility of employment for parents with the fewest financial resources.
The 2026 National Parent Survey highlights meaningful differences in how moms and dads experience parenthood. While some preferences diverge significantly along gender lines, moms with young children on average report more financial and material challenges than dads. Moms are more likely to have trouble meeting their familyŌĆÖs basic needs, with 43 percent saying they have struggled ŌĆ£oftenŌĆØ or ŌĆ£sometimesŌĆØ over the last year, compared to 34 percent of dads reporting the same.
ŌĆ£I am a single mom, and itŌĆÖs hard to find a job without child care, and I canŌĆÖt afford child care without a job.ŌĆØ
ŌĆöMom of two, Alabama
ŌĆ£ItŌĆÖs hard being a single parent with little help, but I make it happen the best way I can.ŌĆØ
ŌĆöMom of one, Missouri
Moms are, at 42 percent, also more likely to say that they cannot afford to spend their time the way they would like, compared to 30 percent of dads. These gaps are rooted in significant income disparities: Moms are overrepresented among lower-income parents with children under six and comprise the vast majority of single-adult households with young children.
Beyond economic hardship, moms with children under six are more likely than dads to cite a lack of support with household responsibilities (31 percent versus 18 percent), child-related responsibilities (24 percent versus 14 percent), and reliable back-up child care (27 percent versus 18 percent) as barriers to spending time the way they would like.
ŌĆ£I hope they create a life of meaningful relationships, grow up to be kind, gracious, driven, and compassionate, and have the tools to cope when things are challenging.ŌĆØ
ŌĆöMom of two, Colorado
For most parents with young children, parenting is challenging. But parentsŌĆÖ own perception of parenting is not as negative as the news or our current politics might suggest. ┬ķČ╣╣¹Č│┤½├Į one in 10 parents (11 percent) with young children say that parenting is extremely challenging, while 27 percent say it is very challenging and 45 percent only somewhat challenging.╠²
ŌĆ£It is demanding and tiring but so rewarding, and I would not change it for the world even though it is the hardest thing IŌĆÖve done.ŌĆØ
ŌĆöMom of two, Oregon
ŌĆ£Our travel is so different [now]. We donŌĆÖt do all the fun shows, but traveling with kids, all the rest of lifeŌĆöhow could you do this any other way? You spend more time in parks and kidsŌĆÖ museums, places kids want to be, but it hasnŌĆÖt made it ŌĆśchallenging,ŌĆÖ itŌĆÖs just made it different.ŌĆØ
ŌĆöDad of two, Colorado15
Taken together with other findings from the survey, including the desire for more quality time with their children and their own descriptions of the most challenging aspects of parenting, this may suggest that it is not parenting in itself, or in isolation, that is stressful. Rather, it is all of the structural factors that impactŌĆöand impedeŌĆötheir ability to parent the way they wish they could. Parents are being pulled in many directions. Indeed, among the highest-income parents with children under six, the most common response to what is most challenging about being a parent of a young child or children is the impact on time. Top challenges cited by the lowest-income parents are the ability to meet their familiesŌĆÖ needs and financial difficulties.
ŌĆ£I wish for them to be in a more stable, financially stable home with a big yard and toys and plenty of room to play. I want to be able to bring them places for fun to have those experiences.ŌĆØ
ŌĆöMom of two, Louisiana
ŌĆ£I hope [my children] live purposefully. I want them to keep their faith.ŌĆØ
ŌĆöDad of two, Texas
When parents with children under six look to the future and imagine what they hope for themselves and their children, many stories emerge. Parents want their kids to have financial stability, but their dreams go way beyond that: More than material wholeness, parents seek purpose and closeness with friends and family. Parents with the lowest incomes are more likely than those with higher incomes to name success, achievement, and a better life than their ownŌĆölikely reflecting the greater financial pressures they experience. For themselves, parents with lower incomes hope for financial security and housing (strong relationships and social support come in third). For highest-income parents with fewer acute financial stresses, what rises to the top is strong relationships and social support. But by far the most common aspiration of parents is simply that their children are happy and fulfilled, regardless of what form that takes.
ŌĆ£[The most challenging thing about being a parent of a young child is] the way the government is going, not knowing what the future holds for my child as she grows up.ŌĆØ
ŌĆöMom of one, Arkansas
Too often, familiesŌĆÖ voices are missing inputs in policy design and implementation. The New Practice Lab works to change this by making the voices of parents a critical part of our policy and delivery work. The 2026 National Parent Survey demonstrates that when we listen to parents and caregivers at scale about what they need, what they want, and what would actually work best for their lives, a common thread emerges: Beyond financial security, parents with young children hope for and seek more time with their families. But we also see that there is no one path to get there, and creating enabling policies and practices will take more than one action. Families have different ideal visions for these early years, desired approaches to raising children are not homogenous, and parents are not equally positioned in terms of the challenges they face. While no single policy approach can answer every familyŌĆÖs needs, there is much that can be done to tackle common struggles parents have around time, wages, and access to the care options of their choice.
It is critical that policymakers follow available evidence-based research and weigh implementation realities, but they should also consider input from the people who will be most impacted by policy decisions. In the case of parents with young children, doing so points toward a range of potential policy solutions. For one, parentsŌĆÖ work and family lives are not separate, but mutually interdependentŌĆöwith changes to paid work impacting parentsŌĆÖ ability to navigate all of lifeŌĆÖs other responsibilities. We should not think of labor policy and family policy as separate either. Indeed, the survey underscores that a more expansive family policy agenda should tackle wages. In short, working hours need to pay more. But we must also strengthen retirement security to offset earnings losses for parents who reduce their paid working hours when their children are young.
Beyond income, parents need generous paid family and medical leave benefits and access to affordable child care of their choice. This survey shows access to just any available child care seat is not sufficient; all parents should have real options that better match their familyŌĆÖs circumstances and individual childrenŌĆÖs needs. The survey highlights that those needs may look different from zero to five, and policy proposals should be flexible to address that variation year by year as children approach school age.
We must also center families with young children in the design and repurposing of public and private spaces (including transit), making it possible for parents to more easily get around and access the clean and safe parks, playgrounds, and kid-friendly facilities that will make play, time outside, and quality time more routine. There is much work to do through public policy, but building spaces that are welcoming for families is a project that goes beyond government institutions.
To be a parent of a young child in the United States today is to live within profound systemic constraints; to operate under the tightest of margins, both in terms of time and money; and to want more and better options than are currently available. The worthy project of dismantling these constraints to make more room for what parents love about parenthood will require attention to deep-seated inequities and sustained public investment, but this better future is possible. As policymakers at all levels of government and from many perspectives propose solutions, we can start by working proactively to consult those most impacted and design public policies that enable a greater diversity of parenting experiences. By doing so, we are more likely to meet more parents where they are, and make it possible for parents and their children to thrive.
The 2026 National Parent Survey is a nationally representative survey of parents and caregivers of children ages five and younger, conducted by the New Practice Lab in partnership with . The survey was fielded between January 16 and February 2, 2026, and reflects the views of 5,472 parents across all 50 states and the District of Columbia.
The included 37 questions, the majority of which were closed-ended (e.g., multiple-choice, rating scales, select-all-that-apply). Five open-ended questions invited parents to respond in their own words. Responses were not required for all questions; respondents could skip or decline to answer individual items. The survey was designed to cover topics including respondent demographics, current and ideal work arrangements, current and ideal child care arrangements, leave taken and ideal leave duration, barriers to ideal time use, challenges, and hopes for the future. The survey was administered in both English and Spanish, primarily online, with a small number of interviews completed by telephone.
The sample draws from probability-based and nonprobability panels. The first is , a probability-based panel designed to be representative of the U.S. population, from which 1,104 completed interviews were obtained. The second is a nonprobability panel, from which an additional 4,368 interviews were collected using demographic quotas to reflect the national population of parents. Participants received a small monetary incentive for survey completion. To improve the precision of estimates for lower-income families, parents in households with incomes below 200 percent of the federal poverty level were sampled at a higher rate. To ensure the sample is nationally representative, data were weighted using benchmarks from the 2025 Current Population Survey, blending the probability and non-probability samples and adjusting for differences in age, sex, race/ethnicity, education, income, and census region. The overall margin of error for the combined sample is ┬▒2.0 percentage points at the 95% confidence level. Margins of error for subgroup analysesŌĆösuch as those by gender, income, race and ethnicity, or geographyŌĆöare larger and vary depending on subgroup sample size. Subgroup findings should be interpreted accordingly.
Additional questions or requests for the full methodology report can be submitted to [email protected].
The survey relies on self-reported data, meaning responses reflect parentsŌĆÖ own perceptions and experiences, not independently verified information. As readers review this report, conduct their own analysis of the public use data file, and seek to interpret results, we hope to emphasize that this effort was not designed to explore the ŌĆ£whyŌĆØ behind individual responses, or how people formulated their ideal scenario. We caution readers to consider how the following biases could impact responses:
We hold our team to the highest possible standard for rigor and analysis, but we acknowledge that, as humans, we are prone to error. Accompanying this report is a folder of . To reduce the risk of reidentification, the public-use data files do not include the full text of the open-ended question responses. Any mistakes in this report are the authorsŌĆÖ alone and can be submitted to [email protected].
Editorial disclosure: The findings represented in this report represent the authorsŌĆÖ analysis and do not necessarily reflect the positions of ┬ķČ╣╣¹Č│┤½├Į, its staff, fellows, funders, or board of directors.
Senior Policy Advisor, New Practice Lab

Director of Learning and Evaluation, New Practice Lab

Chief of Staff, New Practice Lab