Introducing the 2026 National Parent Survey
The news today is full of stories about parents in crisis. The costs of raising a family, including everything from groceries and clothing to gas and electricity, are climbing across the country. Child care costs, already 10 percent of a married-couple familyās average annual income and 33 percent of a single parentās income, continue to rise.1 Median rent is close to $2,000 per month.2 And inflation remains high, making day-to-day expenses harder to afford.3 Families with children ages zero to five are stretched especially thin, more likely to live in poverty and engage multiple public systems at once. After having children, the average two-parent household experiences a 14 percent drop in income, while single parents, especially women, may have to withstand an up to 36 percent decrease.4 More than a year after the U.S. Surgeon General issued an advisory calling parental stress a public health crisis, headlines like are not uncommon.5
Politicians on both sides of the aisle are increasingly offering prescriptions for what they believe is ailing parents in the United States, from childrenās savings accounts to universal child care. But almost no one has asked parents with young children, directly and at scale, what they actually want their lives to look like. The New Practice Lab at Ā鶹¹ū¶³“«Ć½ now has.
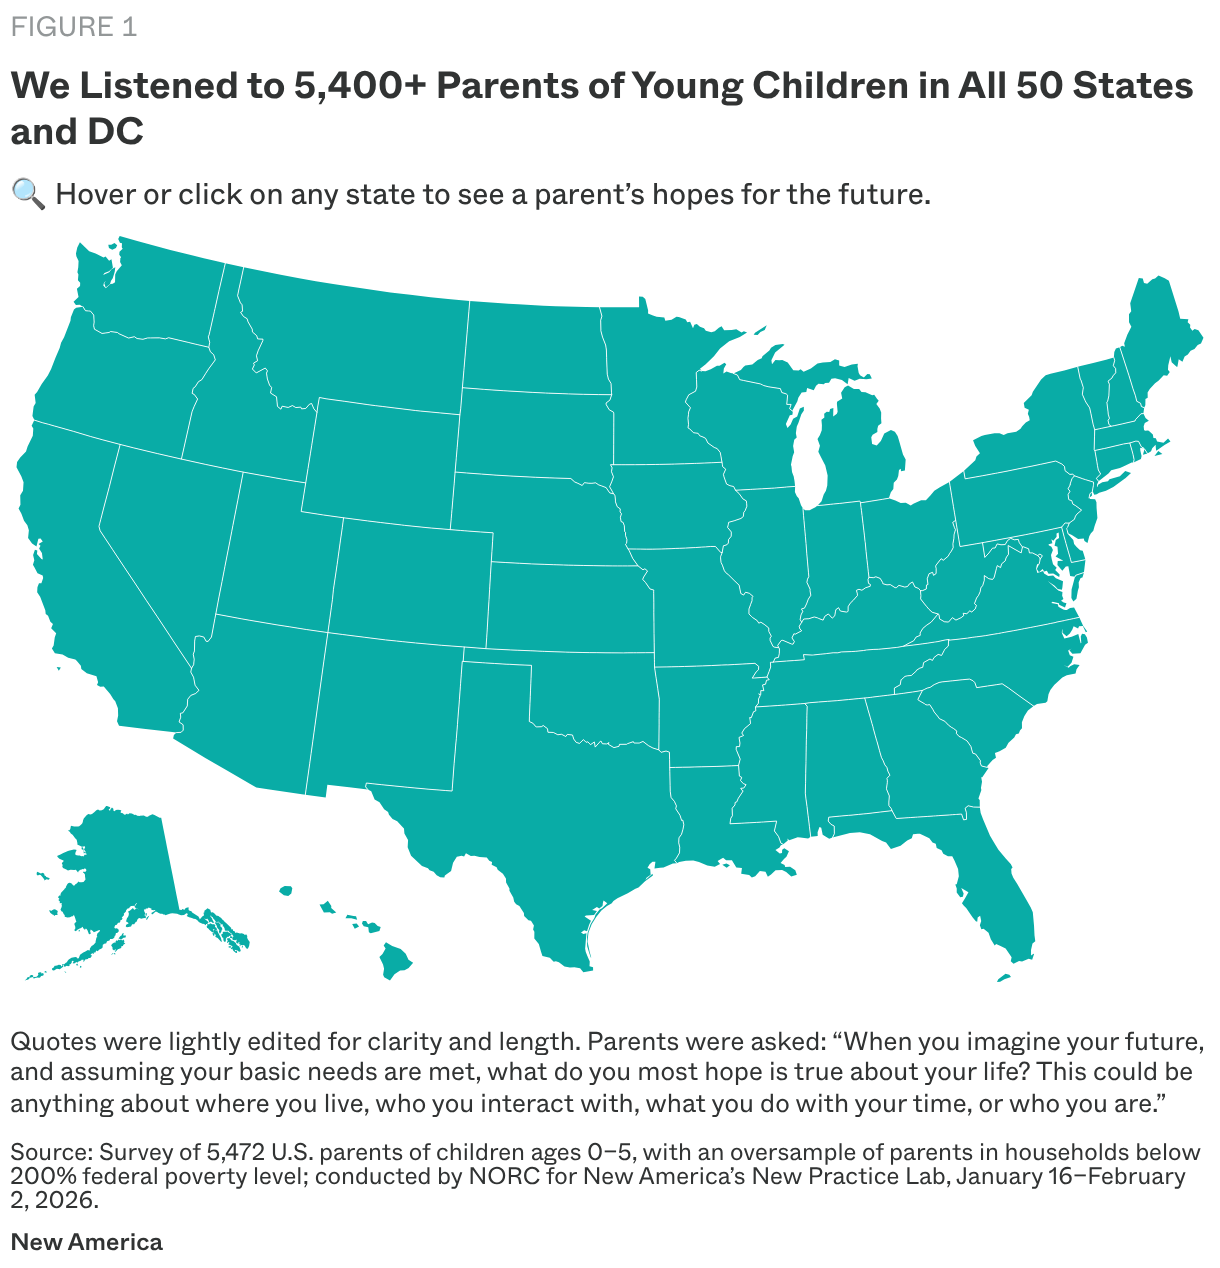
At the beginning of 2026, the New Practice Lab fielded the largest-of-its-kind representative survey of U.S. parents with children under the age of sixāthe 2026 National Parent Surveyāhearing from 5,472 individual parents from every corner of the country.6 This included 2,915 parents with lower incomes, defined here as household income below 200 percent of the federal poverty level or just under $55,000 for a family of three (see the Appendix for full methodology).7Ģż
Trained as designers, researchers, policy experts, data scientists, and technologists, the New Practice Lab works alongside government partners across the country to build and improve policies, public service delivery systems, and technologies to better support families with young children. This survey was inspired in part by in-depth conversations the New Practice Lab has had with parents over time through our , which underscored the layered and interdependent challenges that those raising young children, but especially those with the lowest incomes, are facing today. While our work is also informed by the many robust quantitative research efforts related to families that already exist, we aimed to focus on topics that are relatively less well-covered terrain.8 Rather than only probe the problems in parentsā lives as they are experienced today, we wanted to ask parents how they wish their lives looked in an effort to surface potentially new solutions. How do parents want to spend their time, and their childrenās time? What do they want their working lives to look like? What do they hope for in their futures?
Throughout this report, we elevate quotes from survey participants to highlight parentsā lived experiences and perspectives in their own words. Here is what they said.
At a Glance: The 2026 National Parent Survey
The 2026 National Parent Survey is a nationally representative survey of parents of young children in the United States, conducted by the National Opinion Research Center (NORC) at the University of Chicago on behalf of Ā鶹¹ū¶³“«Ć½ās New Practice Lab. This work was inspired by , and advances our work alongside government partners to build and improve policies, public service delivery systems, and technologies to better support families with young children. The survey asked parents about their current and ideal work, parental leave, and child care arrangements, as well as challenges and hopes raising children ages five and under.
-
5,472
respondents
-
2,915
parents below 200 percent FPL
oversample -
100%
of states reached, plus DC
When was it conducted? January 16āFebruary 2, 2026
Who responded? The survey reached 5,472 parents and primary caregivers ages 18 or older with children ages zero to five, from all 50 states and the District of Columbia. Respondents reflected a broad range of ages, races and ethnicities, education levels, income levels, and family structures.
How was it conducted? The survey was completed primarily online, with a small number of phone interviews. It was available in both English and Spanish.
Is it nationally representative? Yes, the survey draws on NORCās AmeriSpeakĀ® Panel, a probability-based panel designed to represent the U.S. household population. Results are weighted to reflect the national population of parents with young children. The survey intentionally oversampled parents in households with incomes below 200 percent of the federal poverty level (FPL) to ensure sufficient responses for analysis (which included 2,915 completed interviews).
What did the survey cover? The survey asked parents about their childrenās care arrangements and child care needs, employment and work changes since having children, household finances, parenting challenges, use of and preferences for parental leave, preferences on time use, and hopes for the future. Click used.

Citations
- Child Care in America: 2025 Price & Supply (ChildCare Aware of America, May 2026), .
- Lily Katz, āRental Market Tracker: Asking Rents Fall 2% in the West but Rise 5% in the Northeast, Midwest,ā Redfin Real Estate News, October 3, 2024, .
- Ty Roush, āKey Inflation Meter Jumped Again During Iran Warāas Consumer Prices Remain High,ā Forbes, April 30, 2026, .
- Cassandra Robertson, Tara McGuinness, and MonĆ©e Fields-White, āRaising Young Kids in America Has Become Hell, and the Government Should Finally Acknowledge That,āĢżNew Republic, August 11, 2022, .
- 2024 Parents Under Pressure: The U.S. Surgeon Generalās Advisory on the Mental Health and Well-Being of Parents (Office of the U.S. Surgeon General, 2024), .
- Throughout this report, we use the terms āmoms,ā ādads,ā and āparentsā for readability. The vast majority of respondents (96 percent) were parents, including biological parents, stepparents, adoptive parents, and foster parents. The remaining 4 percent were other caregivers, including grandparents (2 percent); aunts, uncles, or siblings (1 percent); legal guardians (0.7 percent); and other caregivers (0.3 percent).
- Throughout this report, ālower-incomeā refers to parents in households with incomes below 200 percent of the federal poverty level (FPL), and āhigher-incomeā refers to those at or above 200 percent FPL. Where the report refers to ālowest-incomeā or āhighest-incomeā parents, these refer specifically to households below 100 percent FPL and at or above 400 percent FPL, respectively.
- A review of existing national surveys targeted toward or including parents and covering similar topics of work, child care, or timeāincluding the Rapid Survey Project, Survey of Income and Program Participation, and the American Time Use Surveyāfound that while many capture familiesā material hardships and child care use, none ask parents with young children in detail about their preferences or how they would ideally spend their time. Across these surveys, common themes include the utilization and spending on child care, time pressures on working parents, and disparities in family well-being by income and race.