
Diana Drogaris
Engagement Director, The National Zoning Atlas


This article is part of The Rooftop, a blog and multimedia series from Â鶹ąű¶ł´«Ă˝â€™s Future of Land and Housing program. Featuring insights from experts across diverse fields, the series is a home for bold ideas to improve housing in the United States and globally.
With increasing attention on zoning across the U.S., the need for clear, reliable information about how zoning actually works has never been more urgent. (NZA)—a project housed under the nonprofit Land Use Atlas Inc., where we both serve as staff—has emerged as the nation’s leading zoning data repository. Since beginning as the Connecticut Zoning Atlas in 2021, the project has grown into a trusted national resource, one that is , , and across the country.Â
Five years since its start, the NZA covers more than half of U.S. land and population, offering key insights into the rules that govern where and how we create housing opportunities. To date, the database includes 16 completed states (Alaska, Arizona, California, Colorado, Connecticut, Delaware, Hawaii, Massachusetts, New Hampshire, North Carolina, New Mexico, Nevada, Rhode Island, Utah, Virginia, and Vermont) along with dozens of metro areas and thousands of individual jurisdictions in the remaining states.
For every zoned jurisdiction, the NZA follows a standard methodology for analyzing and processing data from zoning code texts and maps. The result is a unified database and where users can explore variables such as housing allowances, procedural requirements, accessory dwelling regulations, and more.Â
This article examines one such variable—multi-family housing allowances—as a window into how openly, or reluctantly, American communities zone for housing diversity. This measure matters because availability of different housing types can determine who can gain entry to a place, and, by extension, the kinds of opportunities available to them: proximity to jobs and education, ease of getting around, and the quality of their surrounding environment.Â
Of the roughly 1.37 billion acres of land that the NZA has analyzed (which is over 60 percent of all land in the U.S.), we found that approximately 18 percent is governed by zoning. While this may seem modest, this share covers where people actually reside: 90 percent of residents in published jurisdictions—174 million people—live within these 230 million acres of zoned land.Â
Most of this zoned land (88 percent) allows residential uses, which includes 71 percent classified as primarily residential and another 17 percent as mixed with residential. The remaining 12 percent is designated for nonresidential uses, such as industrial, commercial, open space, or government.Â
A closer look at this residential land reveals an uneven landscape of multi-family (four-or-more-unit) zoning. Single-family homes can be built by right—meaning without a public hearing or discretionary approval—on roughly 95 percent of residential land nationwide while multi-family is allowed by right on just . This 83-point gap speaks volumes to how land use policy shapes where families can live and how communities develop. In this article, we investigate how 20 large cities and 10 metropolitan areas zone for multi-family housing.Â
The share of land zoned for multi-family versus exclusively for single-family can be a useful indicator of a city’s openness to housing diversity. If zoning determines the type and location of homes, then it directly shapes key qualities of a neighborhood, including who can access it. A using NZA data, for example, found that neighborhoods across Connecticut with higher shares of single-family housing are more segregated by race, ethnicity, income, and education.Â
Large urban centers with a high demand for a variety of housing types should be well situated to accommodate greater housing diversity. However, a sample of 20 large cities with populations between 500,000 and one million residents (listed in Table 1) reveals that making room for multi-family housing is not universal. While most cities in the sample exceed the 12 percent national average of multi-family-zoned land, substantial portions of land remain reserved exclusively for single-family use, constraining the supply of alternative housing options.
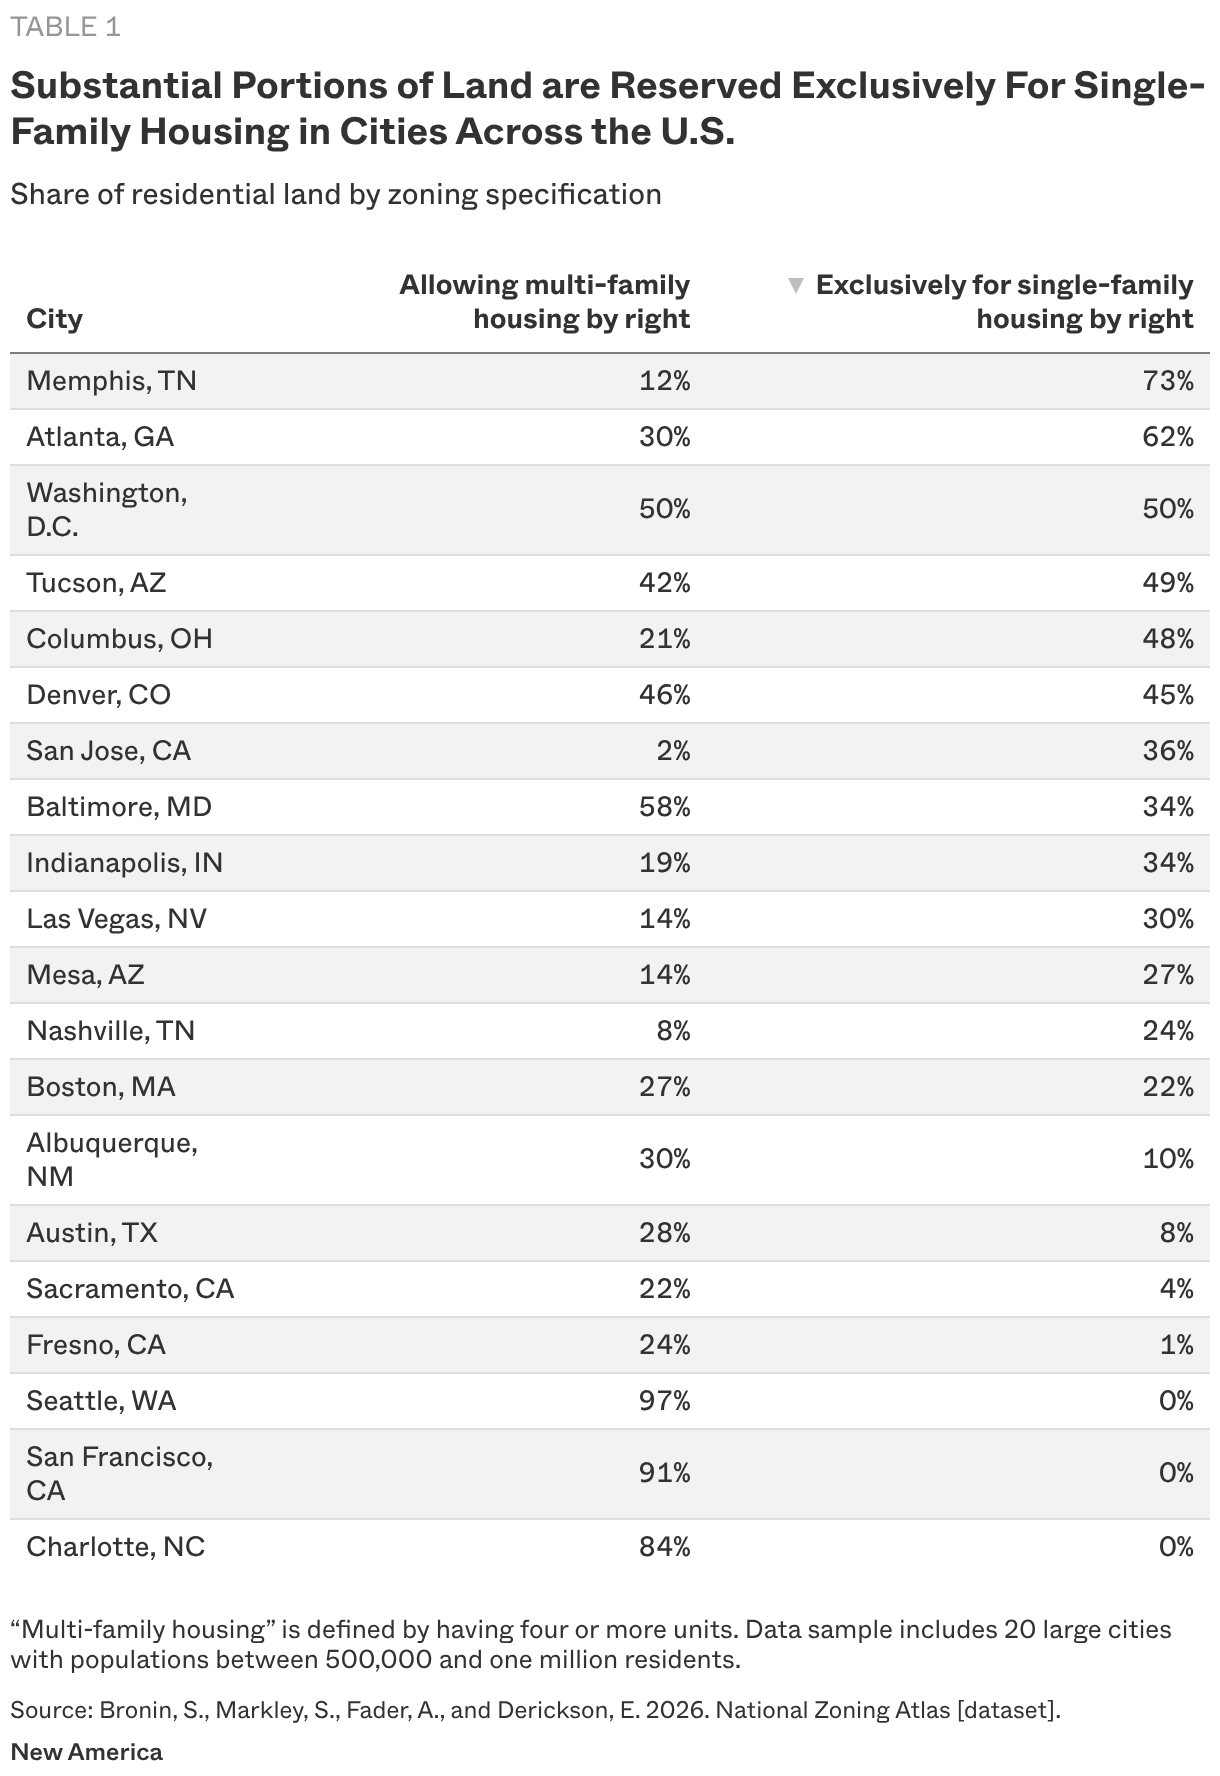
Shares of multi-family allowances vary widely across the sample, but the data suggests that cities cluster in at least three categories. First, there are cities like Charlotte, San Francisco, and Seattle that allow multi-family housing on the majority of residential land, with no land reserved exclusively for single-family housing. A second, broader group—including cities like Albuquerque, Austin, Boston, and Sacramento—have modest multi-family housing allowances, but dedicate more residential land exclusively to single-family housing.Â
By contrast, cities like Atlanta, Las Vegas, Nashville, and San Jose are more exclusionary in terms of housing types: land zoned exclusively for single-family housing accounts for more than double the share allowing multi-family housing. The variation across cities, however, only tells part of the story.Â
The sharpest divide is found when you cross city limits into surrounding suburbs. Table 2 compares the share of residential land allowing multi-family housing by right in principal cities—the largest incorporated place in each U.S. Census-designated Core Based Statistical Area—relative to their surrounding suburban jurisdictions in 10 major metropolitan areas. The final column shows the principal-city-to-suburbs difference in multi-family allowances, highlighting how sharply local multi-family zoning can vary within a single metro area. Â
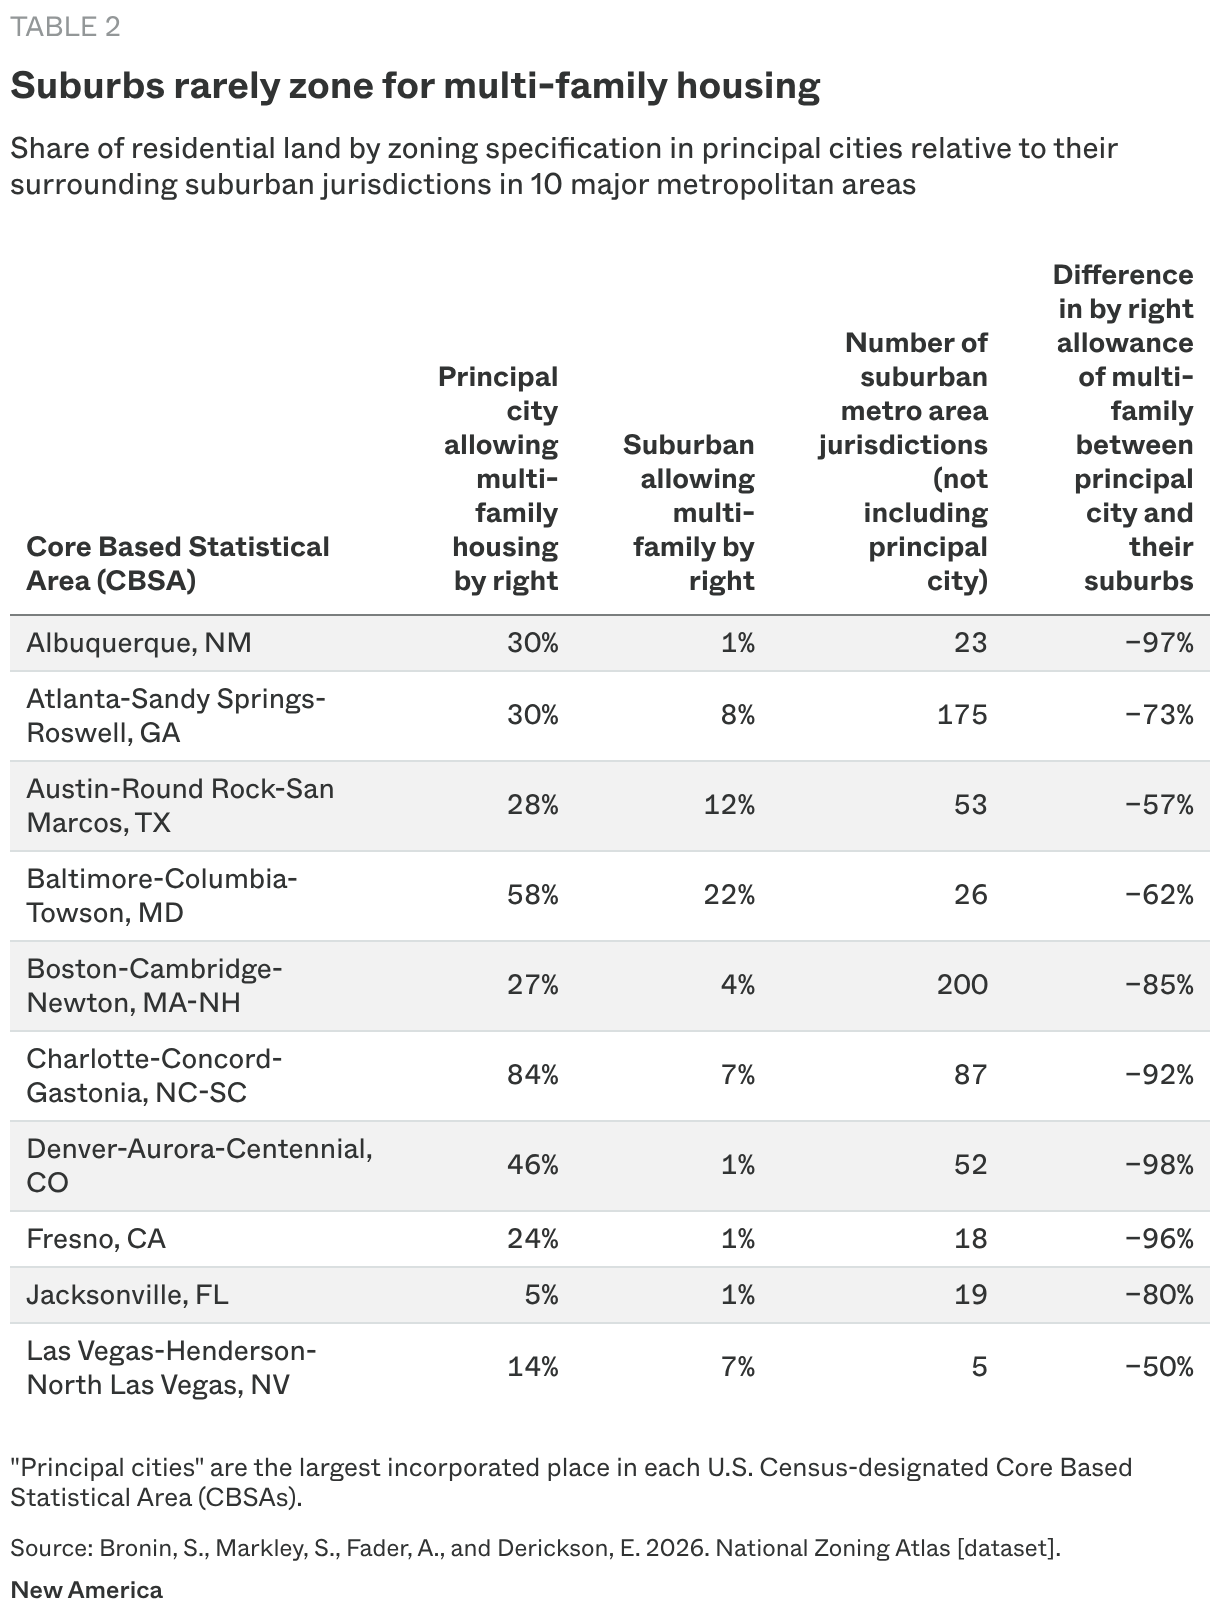
In every metro area, the share of residential land allowing multi-family housing by right in the principal city falls by at least half in its surrounding suburbs. In most cases, multi-family allowances decline by far more.Â
Charlotte–the city with the highest share of multi-family land in the sample–offers a stark illustration of suburban exclusion. Multi-family housing is welcome on 84 percent of residential land within the city, yet that collapses to just 7 percent across the metro’s remaining 87 jurisdictions. Baltimore’s zoning demonstrates a similar pattern. These cities show that even broad multi-family allowances in urban centers do not translate to housing diversity in neighboring suburbs. Community leaders in , , and elsewhere are already grappling with the implications of these local decisions, from housing affordability to climate preparedness.Â
The city-suburb gap takes a different form in metro areas like Albuquerque, Denver, Fresno, and Jacksonville. Multi-family allowances vary considerably in the principal cities, but their suburbs consistently restrict multi-family housing to less than one percent of residential land.Â
Housing access is fundamentally regional. Where people can afford to live shapes where they can work, which schools their children attend, how long they spend commuting, and how their communities grow. Zoning thus doesn’t just shape where housing is built: it shapes the distribution of opportunity.Â
Yet zoning decisions are made jurisdiction by jurisdiction, reflecting local politics, priorities, and interests, often without regional consequences in mind. As a result, the gap between single- and multi-family allowances is often wide, especially between cities and their suburbs.Â
The National Zoning Atlas makes the outcomes of these decisions visible and comparable at an unprecedented scale. Using NZA tools like our map and , users can see how their jurisdictions stack up against neighbors, identify target communities, and evaluate whether reforms meaningful change housing conditions. Closing these gaps will require action, but first, it requires knowing where we stand.Â
The figures reflect the NZA dataset as of April 27, 2026.
Editor’s note: The views expressed in the articles on The Rooftop are those of the authors alone and do not necessarily reflect the opinions or policy positions of Â鶹ąű¶ł´«Ă˝.
Engagement Director, The National Zoning Atlas
Senior Zoning Code Analyst, The National Zoning Atlas


