UNDERMINING PELL: VOLUME IV
Acknowledgments
We would like to thank Lumina Foundation and the Bill & Melinda Gates Foundation for their generous support of this work. The views expressed in this report are those of its authors and do not necessarily represent the views of Lumina Foundation or the Bill & Melinda Foundation, their officers, or employees. Riker Pasterkiewicz, Maria Elkin, and Loren Riesenfeld provided communications support.
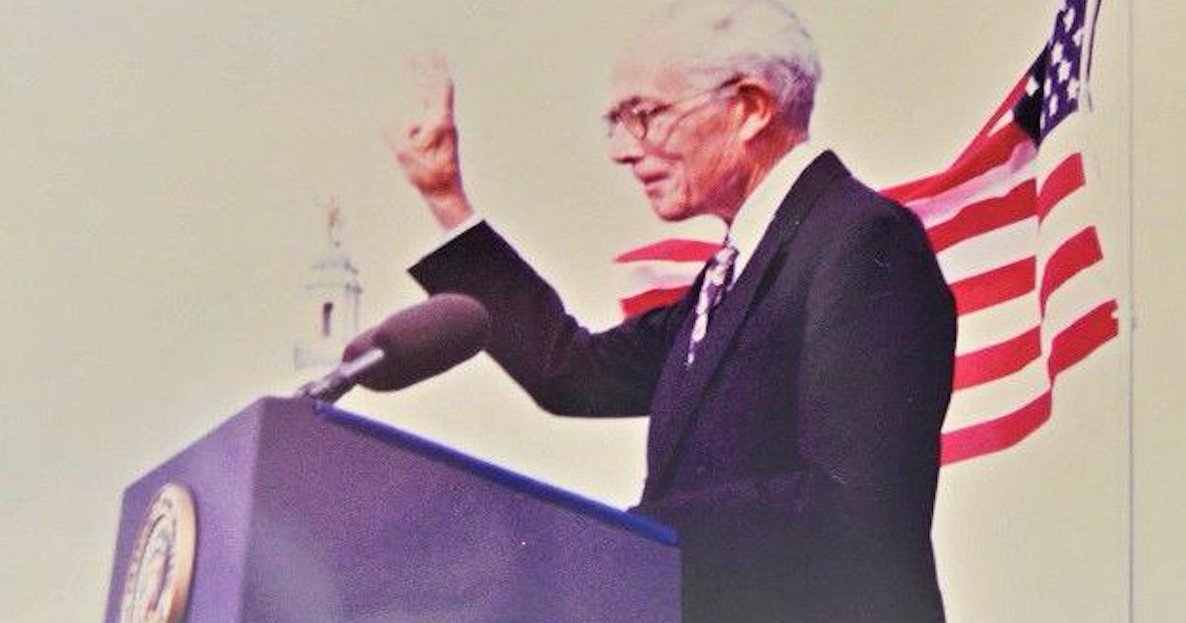
The cover photo is of former Senator Claiborne Pell, the Rhode Island Democrat who was the author of the legislation that created Pell Grants.
Downloads
Data: Undermining Pell IV (CSV zip)
Introduction
In its pursuit of higher-paying out-of-state students, the University of Maine’s flagship campus has taken to the highways. For the past several years, the university has placed billboards on turnpikes in many Northeastern states, as well as in California and Illinois, urging students to “GO TO UMAINE.”1 The billboards promise that students from these states who qualify for admission will receive a scholarship that will allow them to attend Maine’s top public university at the in-state cost in tuition and fees of their state’s public flagship university.2 The non-need-based scholarship program is a moneymaker for the university because the flagships in these states charge higher tuition and fees for in-state students than it does.3 In addition, these students will also have to pay the university the full price for non-tuition expenses, such as room and board, books, and food.4
The University of Maine’s aggressive out-of-state marketing campaign is in many ways a Hail Mary pass. The Orono campus, like many other public colleges and universities in the state, has been struggling for nearly a decade. In response to the national financial crisis, the state of Maine slashed spending on higher education, leaving the university in dire straits, with a $75 million budget deficit.5 Even worse, the state, which has the oldest population in the country, is graduating fewer and fewer high school students. A sharp drop in the birth rate in the state has some experts predicting that the number of potential college-goers will drop by nearly a quarter by 2029.6
“There had been red ink before,” James Page, chancellor of the University of Maine system, told The Chronicle of Higher Education in February. “But there was always a sense that there was some cycle to it, and then you’d come back and make it up. And it became clear that wasn’t going to happen.7
“Past levels of state support weren’t likely to come back, and, more worrisome, neither were past levels of enrollment.”
The University of Maine introduced its “Flagship Match” program during the 2015–16 academic year. In the years since, the university has nearly tripled the amount of money it spends on financial aid for students without financial need (more popularly, if often inaccurately, known as “merit aid”) and doubled the share of non-needy freshmen who receive it, from about 15 to 29 percent.8 The university’s generosity to well-to-do out-of-state students has paid off. The proportion of students from other states has nearly doubled over the past two years, to 36 percent of the student body.9
But the school’s generosity to affluent students has come at the expense of students from Maine who can’t afford to attend without the school’s help. Low-income students were already paying a high average net price — the amount of money that students and their families have to pay after all grant and scholarship aid is deducted from the listed price—of $12,638 when the program started. Since then, the university has significantly reduced the share of financial need it covers, leaving low- and moderate-income students with a larger gap to fill to meet their costs.10 As a result, the average net price that the lowest-income freshmen must pay is on the rise.11
The school’s generosity to affluent students has come at the expense of students from Maine who can’t afford to attend without the school’s help.
Regrettably, the shift in the way that the University of Maine spends its institutional aid dollars is becoming increasingly common at four-year public universities across the country. These schools are increasingly using their limited financial aid budgets to compete fiercely for the students they most desire – the best and brightest and those wealthy enough to pay full freight (or close to it) – rather than for meeting students’ financial need. Low-income students are paying a high price for these policies.
This report examines U.S. Department of Education data showing the average net price for students from families that annually make $30,000 or less at 584 four-year public colleges and universities in the 2015–16 academic year. The analysis finds that more than half of these state-supported institutions (52 percent) expect the neediest freshmen to pay over $10,000, an amount that equals more than a third of their families’ yearly earnings. Â鶹ąű¶ł´«Ă˝ 8 percent expect these students and their families to pay more than $15,000.
This report follows up on three previous papers that Â鶹ąű¶ł´«Ă˝ has published that examined the net price data for the 2010–1112, 2011–1213, and 2013–1414 academic years. In each of these publications, the share of public institutions charging low-income students an average net price over $10,000 has grown.
In our previous volumes, we examined average net price data at both public and private nonprofit four-year colleges. This report, however, focuses exclusively on public institutions. We left out private colleges in this volume because there hasn’t been much change in the results in this sector year after year. Since the 2011–12 report, the share of private colleges charging freshmen with family incomes of $30,000 or less an average net price over $10,000 has remained strikingly high to the detriment of low-income students at around 94 to 95 percent.15
While there is some variation in terms of which private colleges are charging freshmen the highest and lowest average net prices, the overall results have been consistent. Overall, the vast majority of private colleges, which have provided affluent students with hefty amounts of non-need-based aid for decades, are leaving low-income students with extremely high amounts of unmet need, requiring them either to borrow high-interest private loans or have their parents take on large federal Parent PLUS loans to attend them.16 The exception to this rule are some of the country's most elite private liberal arts colleges and universities, like Harvard and Amherst, which are rich enough to fill the full financial need of the high-achieving, low-income students they enroll.17
In contrast to private colleges, the share of public colleges and universities charging the lowest-income, in-state freshmen an average net price over $10,000 has steadily grown with each report. In 2010–11, only about a third (34 percent) of public institutions examined charged these students that much. That share increased to 39 percent in 2011–12 and jumped to 47 percent by 2013–14. And now for the first time, more than half are. Meanwhile, nearly three-quarters of these schools charged the lowest-income students a higher average net price in 2015–16 than in 2010–11, even after adjusting for inflation.
The vast majority of private colleges are leaving low-income students with extremely high amounts of unmet need.
Our finding that public four-year schools are generally becoming less affordable for low-income students is consistent with a separate analysis we conducted last year in which we found that the majority of these institutions have also become less accessible.18 Using data from the Equality of Opportunity Project,19 we found that nearly two-thirds of selective public universities have reduced the share of students they enroll from families in the bottom 40 percent of the income scale since the late 1990s. At the same time, these schools increased the share of students they enroll from the top 20 percent.20
Most notably, at more than half of public institutions (54 percent), the increase in affluent students came at the direct expense of low-income ones. In other words, these schools increased the share of students in the top 20 percent at the same time that they reduced the share from the bottom 40 percent.21
That our public higher education system is increasingly becoming less accessible and affordable for low-income students flies in the face of national goals to increase access to higher education and help more students earn high-quality degrees. Fifty years ago, the federal government committed itself to removing the financial barriers that prevent low-income students from enrolling in and completing college. Policymakers have sought to achieve this goal primarily through the Pell Grant program, which spent about $27 billion in the 2016–17 academic year to help more than 7 million financially needy students pay for college.22
For years, public universities and state colleges complemented the government’s efforts by providing a low-cost education to students in their home states. In so doing, these schools offered students from low-income and moderate-income families a gateway to the middle class. But those days are fading away.23
Over the last 20 years, state disinvestment and institutional status-seeking have worked together, hand in hand, to encourage public colleges and universities to adopt the enrollment management tactics of their private college counterparts. For many of these schools, that has meant using their institutional aid dollars strategically in order to lure affluent out-of-state students to their campuses, rather than spend these funds on in-state students who can’t afford to go to college without the help.24
Overall, too many public colleges and universities are failing to help the government achieve its national college access goals. They are, instead, adding hurdles that could stymie the educational progress of needy students or leave these students with substantial debt after they graduate.
The doors of too many public universities and state colleges are closing to low-income and working class students. It’s time for federal and state policymakers to take notice and work together to reverse these troubling trends before it is too late.
Citations
- Max Larkin, “Fighting Words – And Billboards: How New England Universities Battle for Students,” WBUR’s Edify (Boston, October 18, 2017): .
- Ibid.
- Rick Seltzer, “Tuition Matching, Take 2,” Inside Higher Ed (Washington, DC, May 11, 2017): .
- Kim Dancy and Ben Barrett, “Living on Credit? An Overview of Student Borrowing for Non-Tuition Expenses,” Â鶹ąű¶ł´«Ă˝ (Washington, DC, August 2018): .
- Lee Gardner, “How Maine Became a Laboratory for the Future of Public Higher Ed,” The Chronicle of Higher Education (Washington, DC, February 25, 2018): .
- Ibid.
- Ibid.
- Information about the amount of money that the University of Maine spent on non-need-based financial aid and the share of non-needy freshmen who received it comes from the institution’s 2015–16, 2016–17, and 2017–18 Common Data Set reports, which can found at .
- Ibid.
- On average, the share of financial need that the University of Maine met of students who were awarded any need-based aid (federal, state, or institutional) dropped from 82 percent in 2015–16 to 69 percent in 2017–18, according to the institution’s Common Data Sets for those years.
- According to preliminary figures that the University of Maine has reported to the U.S. Department of Education, in-state students from families making $30,000 or less paid an average net price of $13,360 in 2016–17, $722 more than in 2015–16. The 2016–17 figures will not be finalized until later this year: .
- Stephen Burd, “Undermining Pell: How Colleges Compete for Wealthy Students and Leave the Low-Income Behind,” Â鶹ąű¶ł´«Ă˝ (Washington, DC, May 2013): .
- Stephen Burd, “Undermining Pell 2: How Colleges’ Pursuit of Prestige and Revenue is Hurting Low-Income Students,” Â鶹ąű¶ł´«Ă˝ (Washington, DC, September 2014): .
- Stephen Burd, “Undermining Pell 3: The News Keeps Getting Worse for Low-Income Students,” Â鶹ąű¶ł´«Ă˝ (Washington, DC, March 2016): .
- For 2015–16, we looked at 808 private nonprofit colleges and universities and found that that 756, or 94 percent, charged the lowest-income freshmen over $10,000; 598, or 74 percent, charged over $15,000; 278, or 34 percent, charged over $20,000; 83, or 10 percent, charged over $25,000; and 34, or 4 percent, charged over $30,000. These results are remarkably similar to the ones we found in Undermining Pell 3 for the 2013–14 academic year.
- Rachel Fishman, “The Wealth Gap PLUS Debt: How Federal Loans Exacerbate Inequality for Black Families,” Â鶹ąű¶ł´«Ă˝ (Washington, DC, May 2018): .
- In 2015–16, Pell Grant recipients made up 11 percent of Harvard’s student body and the lowest-income freshmen paid an average net price of $3,294. At Amherst, one of the most socioeconomically diverse elite private nonprofit colleges in the country, Pell Grant recipients made up 23 percent of the student body and the lowest-income freshmen paid an average net price of $6,228. Only two other elite private colleges enrolled more Pell Grant recipients (24 percent)—Beloit and Vassar Colleges—and charged low-income freshmen an average net price below $10,000. These students paid an average net price of $4,478 at Beloit and $5,585 at Vassar.
- Edited by Stephen Burd, “Moving on Up? What a Groundbreaking Study Tells Us Â鶹ąű¶ł´«Ă˝ Access, Success, and Mobility in Higher Ed,” Â鶹ąű¶ł´«Ă˝ (Washington, DC, October 2017): file:///C:/Users/burds/Downloads/Moving-on-Up%20(1).pdf.
- Raj Chetty, John N. Friedman, Emmanuel Saez, Nicholas Turner, and Danny Yagan, “Mobility Report Cards: The Role of Colleges in Intergenerational Mobility,” the Equality of Opportunity Project (January 2017): .
- Burd, “Moving on Up?”
- Ibid.
- The College Board, “Trends in Student Aid 2017” (New York, NY, October 2017): .
- Ozan Jaquette, “State University No More: Out-of-State Enrollment and the Growing Exclusion of High-Achieving, Low-Income Students at Public Flagship Universities,” Jack Kent Cooke Foundation (Lansdowne, VA, May 2017): .
- Ibid.
Methodology
Like the three previous Undermining Pell reports, this report judges four-year colleges based on two criteria: the proportion of Pell Grant recipients they enroll and the average net price they charge the lowest-income students.
Colleges report both the Pell and net-price-by-income data to the U.S. Department of Education’s Integrated Postsecondary Education Data System (IPEDS), which displays the school-by-school data on the College Navigator website.
The Pell data represent the percentage of all undergraduates on a campus that have received Pell Grants. The average net price data represent the average amount of money that students and their families have to pay after all grant and scholarship aid is deducted from the listed price. Colleges report the net price data broken down by income for only first-time, full-time students who receive federal financial aid. Public colleges and universities report on in-state students only. This report specifically looks at the data for students with family income of $30,000 or less. Both the Pell and net price data are for the 2015–16 academic year.
This year’s report examines 584 public four-year colleges in the 50 states. Colleges that did not report average net price data to IPEDs were excluded, as were military academies, and state colleges that primarily award associate degrees.
Public University Results
This report examined 584 public four-year colleges and found the following:
- 305 public colleges, or 52 percent of those examined, charged the lowest-income, in-state freshmen an average net price over $10,000 in the 2015–16 academic year; and 49 of those institutions, or 8 percent of the schools, required these students to come up with $15,000 or more.
- Many of these high-net-price public universities are in states that have adopted a high-tuition model. For example, 54 of these colleges, or 17 percent of the institutions that charged low-income freshmen a higher average net price, are located in just two states—Ohio and Pennsylvania—that have long followed such a model.
- Low-income freshmen attending public universities in their home states paid an average net price above $10,000 in more than half of the states.
- Many public universities that have the means to enroll a significant share of Pell Grant recipients and charge them a low net price choose not to do so. These include some of the country’s most exclusive public universities, which enroll only a small proportion of low-income students. They also include a substantial number of colleges that use their institutional aid as a competitive weapon to attract the students they desire, rather than to meet the financial need of their in-state students.
Public University Trends
Overall, when comparing the average net price data from 2010–11 to 2015–16, the report found that 410, or 71 percent of the public universities examined, increased the average net price they charged the lowest-income, in-state freshmen, even after adjusting for inflation. Of those schools1:
- 307, or 53 percent of the institutions examined, saw their average net price go up by at least $1,000.
- 161, or 28 percent, saw their average net price go up by at least $2,500.
- 32, or 6 percent, saw their average net price go up by at least $5,000.
Of the 169 schools, or 29 percent of the schools examined, that saw decreases:
- 87, or 15 percent of the total institutions examined, saw their average net price drop by at least $1,000.
- 47, or 8 percent, saw their average net price drop by at least $2,500.
- 9, or less than 1 percent, saw their average net price drop by at least $5,000.
Over that same time period:
- The number of public universities that charged in-state freshmen with family incomes of $30,000 or less an average net price under $10,000 has fallen from 361, or 62 percent of the schools examined, to 279 or 48 percent.
- The number of public universities that charged the lowest-income freshmen an average net price over $15,000 has remained fairly steady, increasing by only 12 schools.
Error: Data visualization bundle URL missing.
Citations
- Comparisons were made for 579 of the 584 public colleges and universities examined in the paper. Because of mergers and other restructuring, five of the institutions weren’t operating under their current names in 2010–11.
Taking a Look at the States
For generations, states made college affordable for all of their citizens by keeping the price of their public higher education institutions low. But as more and more states have divested from their public university systems, those days are increasingly in the past.
Error: Data visualization bundle URL missing.
Those in the higher education policy world have long debated about the effectiveness and efficiency of states’ historic low-tuition model.1 Some student aid experts have advocated against this approach, saying that it doesn’t target subsidies effectively because it lowers the cost of higher education for the rich and the poor alike. They have argued that low-income students would benefit more from a high-tuition, high-aid model, in which states devote their subsidies exclusively to those who couldn’t afford to go to college without the help.2
The data in this report, however, don’t bear that out. In fact, they clearly show that the lowest-income students fare much better in states that have kept the cost of attending their public higher education institutions relatively low for in-state students.
Take, for example, the state of Indiana. In the Hoosier State, in-state public four-year college freshmen with family incomes of $30,000 or less paid an average net price of $6,325 in the 2015–16 academic year.
In contrast, the most financially needy in-state freshmen attending public four-year colleges in Pennsylvania paid an average net price that was almost double that amount: $14,281. And while none of Indiana’s 13 four-year public colleges charged the lowest-income freshmen an average net price over $10,000 (with Ball State University charging the most, at $8,697), 37 of Pennsylvania’s 41 public colleges did so, with 16 charging over $15,000. At the University of Pittsburgh, for example, the neediest in-state freshmen paid an average net price of nearly $22,000.
In addition to Indiana, other low-cost states that stand out in terms of keeping their public colleges accessible and affordable for the lowest-income, in-state students include: Washington ($7,444), California ($7,530), North Carolina ($7,846), and Wisconsin ($8,049).
Meanwhile, low-income, in-state freshmen who attend public four-year colleges face average net prices over $10,000 in 26 states, including high-tuition ones such as New Hampshire ($14,781), South Dakota ($14,219), Alabama ($13,952), and Delaware ($13,756).
Citations
- Sarah Turner, “Higher Tuition, Higher Aid and the Quest to Improve Opportunities for Low-Income Students in Selective, Public Higher Education” in Ronald G. Ehrenberg’s What’s Happening to Public Higher Education? (Johns Hopkins University Press, 2007): .
- Vincent Badolato, “Getting What You Pay For: Tuition Policy and Practice,” Western Interstate Commission for Higher Education (Boulder, CO, November 2008): .
Best of the Best: Very High Pell, Low Net Price
At 48 public four-year colleges and universities, Pell Grant recipients make up more than 50 percent of their student bodies and the lowest-income pay an average net price under $10,000.
| School | State | Pell | Net Price |
|---|---|---|---|
| Harris-Stowe State University | MO | 74 | $9,210 |
| Elizabeth City State University | NC | 73 | $2,187 |
| Savannah State University | GA | 73 | $9,806 |
| University of Arkansas at Pine Bluff | AR | 70 | $7,563 |
| California State University-Los Angeles | CA | 68 | $1,672 |
| Atlanta Metropolitan State College | GA | 68 | $4,854 |
| Prairie View A & M University | TX | 65 | $7,447 |
| North Carolina Central University | NC | 65 | $9,710 |
| California State University-San Bernardino | CA | 64 | $3,891 |
| California State University-Dominguez Hills | CA | 63 | $1,261 |
| The University of Texas Rio Grande Valley | TX | 62 | $2,673 |
| California State University-Bakersfield | CA | 62 | $4,216 |
| Coppin State University | MD | 61 | $9,293 |
| Winston-Salem State University | NC | 61 | $9,361 |
| University of California-Merced | CA | 61 | $9,810 |
| California State University-Stanislaus | CA | 60 | $3,930 |
| CUNY Medgar Evers College | NY | 60 | $8,507 |
| Tennessee State University | TN | 59 | $9,657 |
| California State University-Fresno | CA | 58 | $3,489 |
| Kentucky State University | KY | 58 | $6,135 |
| Bluefield State College | WV | 58 | $7,119 |
| North Carolina A & T State University | NC | 58 | $8,053 |
| The University of Texas at El Paso | TX | 57 | $5,037 |
| University of California-Riverside | CA | 56 | $8,854 |
| University of North Carolina at Pembroke | NC | 56 | $8,871 |
| Francis Marion University | SC | 56 | $8,882 |
| CUNY Lehman College | NY | 54 | $3,592 |
| California State University-Northridge | CA | 54 | $4,197 |
| Fayetteville State University | NC | 54 | $5,130 |
| CUNY New York City College of Technology | NY | 54 | $5,623 |
| Northern New Mexico College | NM | 54 | $5,731 |
| California State University-Sacramento | CA | 53 | $5,705 |
| Kent State University at Trumbull | OH | 53 | $7,525 |
| Rutgers University-Newark | NJ | 53 | $7,796 |
| SUNY Buffalo State | NY | 53 | $8,229 |
Source: The above data are from the Department of Education. This is only a selection of schools in the category.
These public regional colleges, many of which are located in urban areas, are the true workhorses in providing social mobility to the large numbers of low-income and minority students they enroll. Many of these schools have leaders who believe that colleges should be more inclusive than exclusive in admitting students.
One such leader is Nancy Cantor, who is the chancellor of Rutgers University at Newark, one of the most racially and socioeconomically diverse college campuses in the country. In 2015–16, 53 percent of the students at Rutgers University-Newark received Pell Grants, and the lowest-income, in-state freshmen paid an average net price of $7,796. Black, Hispanic, and Asian students make up almost two-thirds of the student body.1
Cantor believes that universities should act as “anchor institutions” in the towns and cities in which they reside, working with communities to address what at first glance appear to be intractable problems.2
She took this approach as chancellor of Syracuse University. During her nearly 10-year tenure at Syracuse, from 2004 to 2013, she helped transform the private non-profit university into one of the most socioeconomically diverse private universities of its caliber. And she forged connections with the city of Syracuse—by sending student tutors into local schools, for example, and providing full-tuition scholarships to graduates of those schools who qualified for admission to Syracuse.3
Some faculty members at Syracuse did not appreciate Cantor’s efforts to diversify the campus and revitalize the city. They panicked when the university saw its ranking drop in U.S. News & World Report, and accused her of allowing academic standards at Syracuse to slide, although there was little evidence to suggest these accusations were true.4
Cantor believes that universities should act as “anchor institutions” in the towns and cities in which they reside, working with communities to address what at first glance appear to be intractable problems
When Cantor saw the opportunity to take the chancellorship at Rutgers’ Newark branch, she jumped at it. “It’s really a good fit with the things that I believe in, in terms of the role of higher education in serving the public good,” she told The Daily Orange, Syracuse’s student newspaper, in 2013.5
It wasn’t always so at Rutgers’ Newark campus, which was established in 1946. For much of its early history, the university enrolled students who were overwhelmingly white even though the institution was located in a predominantly black city. As of 1969, minority students made up less than 5 percent of the student body.6 That year, a group of black students seized an academic building called Conklin Hall and held it for three days, demanding that the university make greater efforts to recruit black students and faculty members. Today university administrators, professors, and students celebrate the takeover of Conklin Hall as a transformational event in the university’s history. Still, progress on diversifying the institution was slow and halting and took decades.7
By the late 1990s, U.S. News declared Rutgers-Newark to be the most racially diverse national university in the country.8 But for years, graduation rates for black students significantly lagged those for white students.9 In 2002, after key leadership changes at both the Newark campus and the Rutgers University system, the school’s administrators took the problem head-on and by 2011 had narrowed the gap to just a 1 percentage point difference.10
When Cantor took charge of the university in 2014, she set out to significantly increase the enrollment of Newark residents, make the school more affordable for low-income students, and actively engage these students in efforts to revitalize the city, state, and country.11
Under her leadership, the university made the school tuition-free for Newark students who gain admission and come from families making $60,000 or less. These Talent and Opportunity Pathways (TOP) scholarships are also available to other low-income students who are admitted after earning an associate degree from a community college in New Jersey.12
In addition, the university created the Honors Living-Learning Community (HLLC), a new honors college that focuses on developing the leadership skills of local students.13 Students admitted to the HLLC receive scholarships covering their housing costs and meal plans. The program is extremely competitive. For the first class in 2015-16, the university chose 60 students out of 740 who applied. Of this group, three-quarters were from Newark and 80 percent were members of minority groups.14
Cantor’s single-mindedness on increasing opportunities for Newark students has paid off, as their enrollment has grown by nearly 60 percent since her arrival, according to university officials.15
“We are saying to the young people of the city of Newark and our great state: We see your talent. We honor your talent,” Cantor said when unveiling the TOP scholarship program. “We want you to learn with us—and we want to learn from you—and together with our communities of experts across Newark, the state, the nation, and the world, we are going to make a difference.”
Citations
- Meredith Kolodner, “A University That Prioritizes the Students Who Are Often Ignored,” The Atlantic (Washington, DC, May 19, 2016): .
- Stephen Burd, “Against the Tide: Chancellor Cantor Stands Out Among Higher-Ed Leaders for Commitment to Socioeconomic Diversity,” The Hechinger Report (New York, July 29, 2015): .
- Ibid.
- Robin Wilson, “Syracuse’s Slide,” The Chronicle of Higher Education (Washington, DC, October 2, 2011): . Also see response to this article from Eric Hoover of The Chronicle of Higher Education: .
- Maddy Berner, “Cantor Discusses Move to Rutgers-Newark, Early Exit from SU,” The Daily Orange (Syracuse, NY, June 29, 2013): .
- Kelly Heyboer, “Rutgers-Newark Marks 40th Anniversary of Conklin Hall Takeover,” The Star Ledger (Newark, NJ, February 24, 2009): .
- Bill Glovin, “Turning Point,” Rutgers Magazine (Piscataway, NJ, Fall 2004): .
- Susana Navarro, “Leading the Way in Diversity and Degrees: Rutgers University-Newark,” The Education Trust (Washington DC, September 2014): .
- Ibid.
- Navarro’s paper provides a thorough explanation of how the university attacked the problem. “This newfound focus affected who was hired and how resources were invested,” she wrote. “Chancellors were evaluated based, in part, on improvements in access and completion among low-income students and students of color. Deans focused on hiring faculty of color, building more diverse admission pools, and creating holistic review processes that placed student performance within a socioeconomic context. It also led to the creation of more extensive support mechanisms to ensure that all admitted students were provided academic, financial, and other supports necessary for success at Rutgers.”
- Burd, “Against the Tide.” In addition, these goals are front and center in the strategic plan that Cantor issued in 2014: .
- “Rutgers University-Newark to Make College More Affordable for Students from Newark and New Jersey,” Rutgers Today, Rutgers University-Newark (Newark, NJ, December 17, 2015): .
- Matt Krupnick, “How One University Is Luring Coveted Honors Students with Social Justice,” The Hechinger Report (New York, NY, May 2, 2018): .
- Kolodner, “A University That Prioritizes the Students Who Are Often Ignored.”
- Krupnick, “How One University Is Luring Coveted Honors Students with Social Justice.”
The Next Best: High Pell, Low Net Price
In 2009, the school now known as Utah Valley University (UVU) faced a defining moment. State legislators had voted the previous summer to turn the open-access community college into a four-year public university, and some faculty members were arguing that the institution should try to climb the prestige ladder and transform itself into a research university. But Matthew Holland, the university’s new president, had an alternative path in mind. Like Nancy Cantor, Holland, who left the university this year to become a mission president for The Church of Jesus Christ of Latter-day Saints, argued that the school should value inclusiveness over exclusivity.1
He knew the path he wanted to take—maintaining open-enrollment admissions at a four-year university—was unusual even among regional public universities. “There’s a lot of Harvard envy out there,” Holland told Inside Higher Ed in January, while recounting the choices that the university faced at the time.2 But instead of aping Harvard, Utah Valley has made achieving socioeconomic diversity a primary mission. In 2015–16, Pell Grant recipients made up 34 percent of the study body, and the school charged its lowest-income, in-state freshmen an average net price of $6,794.
UVU is one of 162 public colleges and universities at which Pell Grant recipients made up between 30 and 49 percent of the student body and the lowest-income, in-state freshmen paid an average net price below $10,000 in 2015–16.
| School | State | Pell | Net Price |
|---|---|---|---|
| Concord University | WV | 49 | $6,121 |
| Middle Georgia State University | GA | 49 | $8,771 |
| CUNY York College | NY | 48 | $5,102 |
| University of Washington-Tacoma Campus | WA | 48 | $5,178 |
| California State University-San Marcos | CA | 48 | $5,417 |
| California State University-Monterey Bay | CA | 48 | $6,673 |
| Texas A & M University-Commerce | TX | 48 | $7,203 |
| California State University-East Bay | CA | 48 | $7,330 |
| Missouri Southern State University | MO | 48 | $7,566 |
| Kent State University at East Liverpool | OH | 48 | $8,976 |
| College of Central Florida | FL | 48 | $9,091 |
| Rutgers University-Camden | NJ | 48 | $9,420 |
| Northeastern State University | OK | 47 | $6,586 |
| University of Arkansas-Fort Smith | AR | 47 | $7,113 |
| California State Polytechnic University-Pomona | CA | 47 | $8,523 |
| Ohio University-Southern Campus | OH | 47 | $8,860 |
| University of Hawaii at Hilo | HI | 47 | $9,487 |
| Daytona State College | FL | 46 | $3,400 |
| California State University-Fullerton | CA | 46 | $4,540 |
| The University of Tennessee-Martin | TN | 46 | $6,866 |
| University of Houston-Victoria | TX | 46 | $8,280 |
| West Virginia University at Parkersburg | WV | 46 | $8,308 |
| Mississippi University for Women | MS | 46 | $9,197 |
| CUNY Bernard M Baruch College | NY | 45 | $5,446 |
| University of Houston-Downtown | TX | 45 | $6,552 |
| College of Staten Island CUNY | NY | 45 | $6,864 |
| Kent State University at Salem | OH | 45 | $7,454 |
| Cameron University | OK | 45 | $7,775 |
| University of North Carolina at Greensboro | NC | 45 | $8,022 |
| Wayne State University | MI | 45 | $8,107 |
| University of California-Irvine | CA | 45 | $9,280 |
| California State University-Chico | CA | 45 | $9,378 |
| San Francisco State University | CA | 45 | $9,598 |
| The Evergreen State College | WA | 45 | $9,997 |
| CUNY Hunter College | NY | 44 | $5,661 |
Source: The above data are from the Department of Education. This is only a selection of schools in the category.
Nearly all of these schools are regional colleges. Some are part of state systems, like California State and CUNY and SUNY campuses, which have been helping low-income and working-class students enter the middle class for generations. Only two—the University of Hawaii at Manoa and the University of California at Berkeley—are public flagship universities. There are, however, a number of satellites of flagship institutions. Generally these schools, like the University of Arkansas at Fort Smith and the University of Tennessee at Martin, are less selective than the flagships and tend to enroll students who are weaker academically and lower on the income scale than those attending the main campus.
The Equality of Opportunity Project’s landmark study on social mobility had good and bad news for public regional colleges.3 The researchers found that these schools have been the unsung heroes of higher education in terms of helping low- and moderate-income students rise up the income ladder. But they also discovered that many of these schools have become less accessible in recent years.4
Take Stony Brook University, a public research university in Long Island that has had a strong track record of providing social mobility to its less well-off students. The study found that since the late 1990s, the share of traditionally aged Stony Brook students coming from families in the bottom 40 percent of the income scale (those with annual incomes below $37,000 in 2013) had dropped by 8.5 percentage points. At the same time, the share of students in the top 20 percent had grown by about 7 percentage points.5
Looking at the Education Department’s Pell Grant data, it appears that the decline in low-income students has been especially steep over the last five years. In fact, the share of Pell Grant recipients grew from 30 to 37 percent between 2008–09 and 2011–12 but has fallen steadily since then to 33 percent.6
This drop came at a time when the state has significantly decreased the share of the university’s budget that it covers. To make up for lost revenue, Stony Brook ratcheted up its enrollment of wealthy foreign students and higher-paying out-of-state students, which appears to have left fewer seats available for low-income and working-class ones from New York.7
Many public universities are going down the same path as Stony Brook: seeking out wealthier students to make up for state budget cuts and to become more prestigious. Year after year, the enrollment management offices at these schools release strategic plans where they show how they are going to work their magic to make their schools more selective and rise up the U.S. News rankings, while bringing in more revenue.
Not Utah Valley. Instead, the school, which currently enrolls about 37,000 students, published a “strategic inclusion” plan, where it laid out its goals to bring in more low-income and minority students, as well as those who are the first in their families to go to college.8 Among other things, the plan calls for more actively recruiting underrepresented students and raising money for generous scholarships to help these students pay for college.9 These moves are paying off. Nearly two out of every five undergraduates at UVU are first-generation students.
The most significant decisions that Holland made, however, were to have the university remain open to everyone and to take a “structured enrollment” approach. Under this policy, students who don’t have grades or ACT scores that the school considers “college-ready” are placed in the university’s certificate or associate degree programs. Certificate students can then move up to earn an associate degree, and associate-degree recipients can use their credits to skip ahead to upper division courses so that they can earn a bachelor’s degree within at least two years. This structured approach, which several public universities in Utah have adopted, allows community college students to pursue a bachelor’s degree without having to transfer to another institution and risk losing hard-earned credits.10
Having a community college within a university not only provides “more opportunities for more people,” Holland wrote last year, but also has “a cultural upside.”11
“There is considerable value in bringing together student populations not normally educated at the same institution,” he stated. “As racial and class violence and polarized populations roil the country, bringing together disparate sets of people to learn and socialize together can help bridge the gap between educated elites and the working classes, as well as other divides.”12
“I see it happen every day at UVU,” he added.
Citations
- Paul Fain, “Utah Valley University Thrives by Being Both Community College and University,” Inside Higher Ed (Washington, DC, January 16, 2018): .
- Ibid.
- Raj Chetty, John N. Friedman, Emmanuel Saez, Nicholas Turner, and Danny Yagan, “Mobility Report Cards: The Role of Colleges in Intergenerational Mobility.”
- Ibid.
- Ibid.
- Colleges have been required to report the share of Pell Grant recipients they annually serve to the Education Department’s Integrated Postsecondary Education Data System (IPEDS) since the 2008–09 academic year: .
- Burd, “Moving on Up?”
- “UVU Strategic Inclusion Plan 2014-2018,” Utah Valley University (Orem, UT, August 20, 2014): .
- Ibid.
- Paul Fain, “Utah Valley University Thrives by Being Both Community College and University.”
- Matthew S. Holland, “Utah Valley University’s Dual Education Model: How One School Built a Thriving University Around a Community College,” American Association of State Colleges and Universities (Washington, DC, Fall 2017): .
- Ibid.
Country-Club Public Universities: Low Pell, Low Net Price
Sixty-nine public colleges and universities enroll 29 percent or fewer Pell Grant recipients and charge the lowest-income, in-state freshmen an average net price under $10,000.
| School | State | Pell | Net Price |
|---|---|---|---|
| College of William and Mary | VA | 11 | $4,459 |
| Bellevue College | WA | 12 | $7,174 |
| University of Virginia-Main Campus | VA | 12 | $9,463 |
| University of Wisconsin-Madison | WI | 14 | $7,667 |
| University of Michigan-Ann Arbor | MI | 15 | $2,660 |
| Indiana University-Bloomington | IN | 15 | $5,470 |
| Bismarck State College | ND | 15 | $5,996 |
| Colorado Mountain College | CO | 15 | $7,358 |
| Brazosport College | TX | 16 | $3,223 |
| Georgia Institute of Technology-Main Campus | GA | 16 | $6,293 |
| Purdue University-Main Campus | IN | 18 | $4,250 |
| University of Alaska Southeast | AK | 18 | $7,361 |
| Great Basin College | NV | 18 | $8,169 |
| Vincennes University | IN | 18 | $8,535 |
| St Mary's College of Maryland | MD | 18 | $8,933 |
| University of Maryland-College Park | MD | 19 | $7,645 |
| University of Minnesota-Twin Cities | MN | 19 | $7,694 |
| University of Iowa | IA | 19 | $8,259 |
| Minot State University | ND | 20 | $7,233 |
| University of Minnesota-Crookston | MN | 20 | $7,640 |
| Northwest Florida State College | FL | 20 | $7,897 |
| Truman State University | MO | 20 | $8,238 |
| Ohio State University-Main Campus | OH | 20 | $8,442 |
| University of Wisconsin-La Crosse | WI | 20 | $9,233 |
| Louisiana State University and Agricultural & Mechanical College | LA | 21 | $5,694 |
| North Carolina State University at Raleigh | NC | 21 | $6,701 |
| University of Alaska Fairbanks | AK | 21 | $7,163 |
| Louisiana Tech University | LA | 21 | $7,371 |
| University of Illinois at Urbana-Champaign | IL | 21 | $7,554 |
| Iowa State University | IA | 21 | $8,692 |
| University of North Carolina at Chapel Hill | NC | 22 | $3,889 |
| University of Washington-Seattle Campus | WA | 22 | $7,129 |
| University of Minnesota-Duluth | MN | 22 | $7,380 |
| Midland College | TX | 22 | $7,856 |
| Texas A & M University-College Station | TX | 22 | $8,037 |
Source: The above data are from the Department of Education. This is only a selection of schools in the category.
This group includes some of the most elite public universities in the country, including 19 public flagship universities.1 Like their prestigious private college counterparts, these schools tend to offer generous amounts of need-based aid. Yet, compared with other public colleges and universities, these institutions enroll only a small share of low-income students. The schools tend to overwhelmingly serve the well-to-do.
Take the College of William & Mary. In 2015–16, our data show that William & Mary was the least socioeconomically diverse public college in the country, with only 11 percent of its students receiving Pell Grants.
Data from the Equality of Opportunity Project show that, for the Class of 2013, nearly three-quarters of traditionally aged students at the school came from families in the top 20 percent of the income scale. The average family income of students that year was $270,577 and the median was $176,400, the highest amount of any public university.2
More than half of the William & Mary students in that class (56 percent) came from families in the top 10 percent of the income scale (making $144,000 or more) and more than a third were from families in the top 5 percent (making at least $189,000). Over 6 percent came from families in the top 1 percent, making at least $631,000. Two other public universities on this list—the Universities of Michigan and Virginia—served even more 1-percenters than William & Mary.3
Although schools like William & Mary are bastions of privilege, they largely do right by the limited number of low-income students they enroll by devoting the lion’s share of their financial aid to the students who need it most. But as the “merit”-aid arms race sweeps through the public four-year university sector, some of these institutions are finding it harder and harder to do the right thing.
The University of Illinois (UI) at Urbana-Champaign, the state’s flagship campus, is a case in point. Although the school gives out some non-need-based aid, it continues to provide the bulk of its financial aid dollars to financially needy students.4 As a result, the university’s lowest-income, in-state students who started school in 2015–16 paid the relatively low average net price of $7,554.
The decision of the relatively high-priced school to stay committed to need-based aid has put the school at a major disadvantage.5 Other states’ public flagship and research universities have set up permanent shop in Illinois in order to lure high-achieving and wealthy students to their campuses by offering generous non-need-based scholarships that make going out of state more affordable than going to UI.6
These carpetbagger recruiters have been remarkably successful. Today, nearly half of all Illinois students leave the state to go to college. That’s up from less than one-third back in 2000.7 In 2016, the state suffered a net loss of more than 19,000 students. Only New Jersey experienced a bigger loss.8
As a result, UI has faced declining yields year after year, meaning that the school has had to accept ever-larger numbers of Illinois students to keep enrollment steady.9 University officials have no illusions about why so many top students are going elsewhere.
“We’re obviously concerned that lots of schools in competing states are trying to compete for Illinois students. We know that many times, they are trying to give them scholarships, grants, awards to make them [the out-of-state schools] seem on par with our costs,” Dan Mann, the university’s interim associate provost for enrollment management, told the student newspaper in April. “We have chosen here to provide most of our financial aid as need-based financial aid instead of merit-based.”10
The majority of top Illinois students who leave the state go to flagships in neighboring ones, such as the Universities of Iowa and Missouri. Since 2013, the University of Iowa has provided these students with $10,000 scholarships that lower their tuition to the amount that Iowa residents pay.11 In 2017, Illinois students made up nearly 30 percent of Iowa’s freshmen class.12
While it’s not surprising that Illinois students would go to other Midwestern universities, a large number are going to more far-flung schools that have bid the highest for them.
One institution that has been extraordinarily successful in luring Illinois students is the University of Alabama, which has been the most aggressive public university in the merit-aid arms race.13 The university has at least 36 full-time admissions officers, armed with generous scholarships, spread throughout the country to attract top students from affluent families to the school.14
According to the Chicago Tribune, more than 1,600 Illinois students were part of the Crimson Tide last year, up from about 150 a decade ago.15 “And Alabama isn’t taking just any student; many are among Illinois’ brightest,” the newspaper reported. “More than 700 Illinoisans from 193 cities made the president’s and dean’s lists at Alabama, earning at least a 3.5 GPA for fall 2017. They are meeting one another in classes, clubs and sororities, and through campus group chats.”16
It’s no mystery why so many top Illinois students are coming to Tuscaloosa. At “Illinois colleges, the in-state tuition is so expensive,” Caroline Ward, who was one of 203 freshmen from the state who received full-tuition scholarships last year to attend the University of Alabama, told the Tribune in April. “Students are looking for those scholarships, and they’re going to take them wherever they could get them.”17
Several years ago, the University of Wisconsin at Madison, which is also on this list, faced the same type of pressure that Illinois’s flagship university is facing now. The school decided that it had no other choice but to join the fray and significantly boost its spending on non-need-based aid to stop institutions from other states from grabbing up the best Wisconsin students.18
“Students are looking for those scholarships, and they’re going to take them wherever they could get them.”
“It worries me a great deal, the type of merit aid I see being offered to top students from Wisconsin,” Rebecca Blank, chancellor of the University of Wisconsin at Madison, told Inside Higher Ed in 2015. “As far as I’m concerned—I’m an economist—that’s a real waste of where we should be spending our money in higher ed. But I’ve got to keep some of those top students in Wisconsin.19
“We’ve got to play in that game,” she added. “We just have to.”
The University of Illinois is feeling the heat, but hasn’t gone quite as far as the University of Wisconsin, which is also using non-need-based aid to pursue out-of-state students. Instead, this spring, the university persuaded the Illinois state legislature to create a new $25 million merit-based scholarship program for high-achieving students that the state’s public universities must match.20 The recipients of the scholarships cannot, however, come from families who have annual income more than six times the national poverty rate, which is currently $25,100 for a family of four.21
Will this step do enough to stem the tide? Or will the University of Illinois feel the pressure to take more aggressive steps in the future? The answer to those questions could have a major impact on whether the school remains affordable and accessible for low-income students.
Citations
- The four public flagship universities that enroll the smallest share of Pell Grant recipients are the University of Virginia (12 percent), the University of Wisconsin at Madison (14 percent), Indiana University (15 percent), and the University of Michigan (15 percent).
- Burd, “Moving on Up?”
- Ibid.
- According to the 2016–17 Common Data Set of the University of Illinois at Urbana-Champaign, the school spent about 86 percent of its $98 million institutional aid budget on need-based aid the previous year.
- Dan Bauman, “Why Students Are Leaving Illinois in Droves—and Why It Matters,” The Chronicle of Higher Education (Washington, DC, February 2, 2018): .
- Ibid.
- Dawn Rhodes, “Growing Brain Drain: University of Alabama’s Gain in Drawing Illinois Students Is a Loss for Illinois,” Chicago Tribune (Chicago, IL, April 6, 2018: .
- Bauman, “Why Students Are Leaving Illinois in Droves.”
- Rhodes, “Growing Brain Drain.”
- Heather Schlitz, “Increase in UI Budget Request to Help Retain In-State Enrollment,” The Daily Illini (Urbana-Champaign, April 19, 2018): .
- Bauman, “Why Students are Leaving Illinois in Droves.”
- Ibid.
- Burd, “The Out-of-State Student Arms Race.” See also Laura Pappano, “How the University of Alabama Became a National Player,” The New York Times (New York, NY, November 3, 2016): .
- Pappano, “How the University of Alabama Became a National Player.”
- Rhodes, “Growing Brain Drain.”
- Ibid.
- Ibid.
- Burd, “Undermining Pell 3,” pgs. 28–29.
- Kellie Woodhouse, “Playing the Aid Game,” Inside Higher Ed (Washington, DC, December 18, 2015): .
- Heather Schlitz, “Statewide Program to Provide Merit-Based Aid,” The Daily Illini (Urbana-Champaign, IL, June 14, 2018): .
- Ibid.
High-Net Price Public Universities
The humble beginnings of Temple University seem almost too good to be true. A young working-class man in 1884 asked Russell Conwell, a Philadelphia Baptist minister, traveling lecturer, and a bit of an entertainer, to tutor him at night, and soon Conwell was holding night classes for dozens of others. A few years later, he received a charter from the state to transform his classes into “Temple °ä´Ç±ô±ô±đ˛µ±đ.”1 From then on, the university dedicated itself to educating local working-class students so they could go into professions that would help propel them up the income scale.2
Temple “has educated Philly’s middle-class backbone—dentists, nurses, teachers—for generations,” Philadelphia Magazine reported in 2014, adding that “one in seven area college grads is a Temple alum.”3
So given that background, why does Temple ask the lowest-income, in-state freshmen to pay an average net price that equals more than half of their families’ yearly earnings? In 2015–16, these students were left on the hook for $16,638. Only 20 other public colleges and universities charged more.4
Severe state budget cuts are part of the reason, as well as the fact that Temple has a modest endowment.5 But much of the blame goes to university officials and board members who became obsessed with rising up the U.S. News & World Report rankings and making the former commuter campus more prestigious. As part of that effort, the university designed a non-need-based aid program that was so generous it threw the school into a huge deficit and caused an uproar on campus that ended up costing both the president and the provost their jobs.
Temple is one of 305 public colleges and universities that charged the lowest-income, in-state freshmen an average net price of $10,000 or more in 2015-16. Of these schools, 49, including Temple, required these students to come up with $15,000 or more.
| School | State | Pell | Net Price |
|---|---|---|---|
| Colorado School of Mines | CO | 15 | $23,542 |
| University of Pittsburgh-Pittsburgh Campus | PA | 16 | $21,581 |
| South Carolina State University | SC | 67 | $21,333 |
| Pennsylvania State University-Main Campus | PA | 15 | $20,873 |
| Pennsylvania College of Technology | PA | 39 | $20,743 |
| Pennsylvania State University-Penn State Altoona | PA | 30 | $18,938 |
| Texas Southern University | TX | 65 | $18,896 |
| Pennsylvania State University-Penn State Erie-Behrend College | PA | 30 | $18,780 |
| Montclair State University | NJ | 41 | $18,750 |
| The University of Alabama | AL | 19 | $18,686 |
| South Dakota State University | SD | 22 | $18,001 |
| Massachusetts College of Art and Design | MA | 27 | $17,749 |
| Northern Illinois University | IL | 44 | $17,643 |
| Wichita State University | KS | 35 | $17,636 |
| Armstrong State University | GA | 45 | $17,552 |
| Pennsylvania State University-Penn State Berks | PA | 33 | $17,083 |
| Grambling State University | LA | 82 | $16,844 |
| University of Northern Colorado | CO | 31 | $16,776 |
| University of New Hampshire-Main Campus | NH | 21 | $16,750 |
| Pennsylvania State University-Penn State Harrisburg | PA | 32 | $16,640 |
| Temple University | PA | 32 | $16,638 |
| Ohio University-Main Campus | OH | 27 | $16,565 |
| South Dakota School of Mines and Technology | SD | 21 | $16,489 |
| Lincoln University | PA | 63 | $16,476 |
| Plymouth State University | NH | 29 | $16,287 |
| Oregon State University | OR | 28 | $16,102 |
| Pennsylvania State University-Penn State Mont Alto | PA | 34 | $16,022 |
| University of Alabama in Huntsville | AL | 29 | $15,971 |
| California University of Pennsylvania | PA | 39 | $15,810 |
| Bridgewater State University | MA | 35 | $15,805 |
| Longwood University | VA | 24 | $15,786 |
| University of Cincinnati-Main Campus | OH | 23 | $15,768 |
| Delaware State University | DE | 51 | $15,762 |
| University of Montevallo | AL | 40 | $15,658 |
| Shippensburg University of Pennsylvania | PA | 31 | $15,639 |
Source: The above data are from the Department of Education. This is only a selection of schools in the category.
The overall group of 305 schools includes 30 public flagship universities. For the lowest-income students, the five most expensive flagship campuses are Penn State University ($20,873), the University of Alabama ($18,686), the University of New Hampshire ($16,750), the University of Colorado at Boulder ($15,109), and the University of Kansas ($14,760).
The group also includes major public research universities, such as the University of Pittsburgh ($21,581), Oregon State University ($16,102), the University of Cincinnati ($15,768), Auburn University ($15,591), George Mason University ($15,089), the College of Charleston ($13,818), and Clemson University ($12,905).
Many of these schools are active participants in the merit-aid arms race. But none of them managed their non-need-based aid program as poorly as Temple University did, or had so much turmoil surrounding it.
From the outside, it’s hard to tell how much blame goes to former president Neil Theobald or former provost Hai-Lung Dai or the university’s board. But what is clear is that they had a goal, as was highlighted on the Office of the Provost’s website, of boosting the school’s reputation by obtaining a top 100 U.S. News ranking for national universities. And they put in place policies to help them get there, including trying to attract higher-achieving students.6
To do so, they created an extremely generous non-need-based aid program that provided automatic scholarships that were tied to students’ GPA and SAT scores. To get the minimum scholarship in the fall of 2016, students had to have at least a B average in high school and get an 1150 out of 1600 SAT score.7 Those with higher grades and test scores automatically got larger scholarships.
The program grew quickly. In 2015–16, Temple spent about $62 million, or two-thirds of its institutional aid budget, on non-need-based aid. That amount was almost 10 times more than it spent a decade earlier, when merit aid made up a little more than one-fifth of the school’s aid budget.8 The heavy spending on this program took a toll on low-income students. The average amount of financial need that the university covered plummeted to 69 percent in 2015–16, a drop of 19 percentage points from 10 years earlier.9
The non-need-based aid program, as well as other changes the university made, appeared at first to have the desired effect. From 2012 to 2016, Temple rose 17 spots in the U.S. News national university rankings, to 115, one of the biggest jumps in the category during that period of time.10 Explaining the rise in a campus publication in 2016, Jodi Levine Laufgraben, vice provost for academic affairs, assessment and institutional research, said, “We’ve improved in a number of key indicators that U.S. News uses to calculate the rankings: faculty resources, financial resources, graduation rate, student selectivity and more.”11
But the automatic nature of the scholarship program came back to bite the university. Too many incoming students were receiving the awards, even after university officials raised the standards. Over 700 students qualified for the scholarships for the fall of 2016, putting the school $22 million in the red.12 When the news became public in June of that year, Theobald shocked the campus by firing Dai. A week later, the board’s leaders, who had been close to the provost, demanded Theobald’s resignation, arguing that the president had been fully aware that the shortfall was coming.13
Too many incoming students were receiving the awards, even after university officials raised the standards.
Some at the university hoped that the shake-up would force university officials and the board to reexamine their priorities. “Everybody sort of likes the idea of moving up in the rankings and all that good stuff, but we are doing so perhaps at the cost of serving the population that we’ve traditionally said we’re supposed to serving,” Michael Sachs, the then-president of Temple’s Faculty Senate, said in an interview with the Philadelphia Inquirer. “Are we just bringing in these high-profile researchers and all these better students and losing a sense of our mission to serve first-generation students, etc.?”14
In response to the $22 million deficit, Temple officials scaled back the non-need-based aid program a bit. They limited the number of scholarships they will give out, meaning that some students who have the required grades and test scores will no longer automatically receive the aid. And they decided to be less aggressive in marketing it.15
But despite the hopes of faculty members like Sachs, Temple officials didn’t give up their focus on rankings. And once again, the university’s hunger to move up the pecking order led to a scandal that rocked the campus. This summer, the university admitted to U.S. News that the head of its business school had sent the publication fabricated data about more than half a dozen programs to artificially inflate the school’s rankings.16 In response, U.S. News has at least temporarily stopped ranking the business school.17
The news overall hasn’t been all bad for the university though. In September, U.S. News moved Temple up nine more spots in the national university ranking, tying it with eight other schools at 106.
Meanwhile, according to preliminary Education Department data, the average net price for the lowest-income students shot up even higher in 2016–17, to more than $18,000.
Public flagship and research universities are not the only institutions making significant investments in non-need-based aid and charging the lowest-income students a high average net price. State regional colleges are increasingly participating in the merit-aid arms race as well.
Western Michigan University, for example, spent nearly $12 million, or about one-third of its $37 million institutional aid budget, on non-need-based aid in 2015–16. That year, 22 percent of freshmen received merit scholarships, averaging $5,127 each.18
With a steep reduction in the supply of high school graduates in Michigan and intense competition among colleges in the state for this shrinking pool of students, Western Michigan has been struggling. Enrollment has dropped year after year since it reached a high of about 25,000 in 2002–03.19
“Everybody sort of likes the idea of moving up in the rankings and all that good stuff, but we are doing so perhaps at the cost of serving the population that we’ve traditionally said we’re supposed to serving.”
Edward Montgomery, who became the university’s president last year, has vowed to turn things around by more aggressively pursuing out-of-state students.20 Last year, students from other states made up about 9 percent of the student body. University officials would like to increase the share to 30 percent over the next several years.21
To achieve this goal, the school has slashed tuition and fees for out-of-state students nearly in half to under $15,000.22 Meanwhile, the school is continuing to provide generous scholarships tied to students’ GPA and test scores. The scholarships are not automatic, however. The school chooses among applicants for the awards.
“For us to grow, we have got to improve the number of out-of-state students at this institution,” Terrence Curran, the associate provost for enrollment management, told the Kalamazoo News in December. “That’s the only option…There is no way we’re going to be able to grow with the demographics in Michigan.”23
Western Michigan’s desire to more than triple the share of out-of-state students on campus probably doesn’t bode well for the lowest-income, in-state students, who already pay an average net price of $12,453.
Citations
- From the “History” section on Temple University’s website: .
- Sandy Hingston, “Why Does Neil Theobald Think Football Will Save Temple?,” Philadelphia Magazine (Philadelphia, PA, October 1, 2014): .
- Ibid.
- In addition to Temple, seven of the 20 other public institutions are in Pennsylvania, including Penn State and four of its satellite campuses. The other two schools are the Pennsylvania College of Technology and the University of Pittsburgh. The only other state to have more than one school in the list is Colorado, with the Colorado School of Mines and the University of Northern Colorado.
- According to a September 2018 report in The Temple News, “In 2011, the state approved a 19 percent cut in higher education funding to Temple’s state allocation, from $172 million to $139 million. As a result of state funding cuts, Temple cut nearly $113 million out of its budget from 2009 to 2013.” Temple’s endowment was about $514 million, as of October 2016.
- Hillel Hoffmann, “How Do You Measure Success? Temple’s Master of Statistics Tells All,” Temple Now Philadelphia, PA: .
- Susan Snyder, “Booming Merit Scholarship Program Strained Relations Among Temple’s leaders,” the Philadelphia Inquirer (Philadelphia, PA, July 23, 2006):
- The aid figures come from Temple’s 2005–06 and 2015–16 Common Data Sets.
- The financial need figures come from Temple’s 2005–06 and 2015–16 Common Data Sets.
- Hoffmann, “How Do You Measure Success? Temple’s Master of Statistics Tells All.”
- Ibid.
- Snyder, “Booming Merit Scholarship Program Strained Relations Among Temple’s Leaders.
- Rick Seltzer, “Debating a Provost’s Ouster,” Inside Higher Ed (Washington, DC, July 7, 2016): .
- Rick Seltzer, “Temple President Agrees to Leave,” Inside Higher Ed (Washington, DC, July 22,2016): .
- Joe Brandt, “University Limits Merit Scholarships,” The Temple News (Philadelphia, PA, October 4, 2016): .
- Scott Jaschik, “Temple Rankings Scandal: From Bad to Worse,” Inside Higher Ed (Washington, DC, July 30, 2018): .
- Ibid.
- The non-need-based aid figures come from Western Michigan University’s 2016–17 Common Data Set, which includes estimates for the 2015–16 academic year.
- Kayla Miller, “Western Michigan’s Enrollment Slides as Grand Valley’s Has Swelled,” Kalamazoo News (Kalamazoo, MI, December 20, 2017): .
- Kayla Miller, “How Western Michigan University Plans to Reverse Its Enrollment Decline,” Kalamazoo News (Kalamazoo, MI, December 20, 2017): .
- Ibid.
- Ibid.
- Ibid.
Moving in the Wrong Direction…
The University of Oregon has long been a participant in the merit-aid arms race, but never really stood out. Now it’s trying to up its game.
After five years of enrollment declines, Oregon’s public flagship university laid out an ambitious plan last year to gradually add 3,000 more students to the school, all from other states.1 The university is increasing its out-of-state recruiting staff, with the aim of expanding its presence in as many as 20 states on the East Coast the Midwest, the South, and the West.2 University officials hope the plan will help the institution boost both its revenue and prestige.3
Leading this effort is Roger J. Thompson, who previously was the enrollment manager at the University of Alabama and Indiana University, two schools that have been heavily involved in the arms race.4 Since Thompson’s arrival in 2010 as vice president for student services and enrollment management, the population of out-of-state students has grown at the school while the number of in-state students has fallen.5
Meanwhile, in 2015–16, the lowest-income, in-state freshmen paid an average net price of nearly $12,000, or $1,100 more than they did—in inflation-adjusted dollars—in 2010–11. And while the university provided nearly half of its $34 million institutional aid budget to non-needy students that year, only 7 percent of financially needy freshmen had their full need met. On average, the university filled just 62 percent of the financial need of those students. Despite these large funding gaps, 17 percent of freshmen without financial need received scholarships, averaging $6,133 each.6
University officials insist that their plan will not come at the expense of in-state students since they are expanding total enrollment.7 They also point out that Pell recipients at the school who graduated high school with a GPA of at least 3.4 have their full tuition and fees covered by federal, state, and institutional aid.8
Thompson, in an interview with The Register-Guard in Eugene, acknowledged that the ever-increasing competition among public universities to use their aid dollars to steal students away from their home-state schools “is, in my opinion, the big public policy issue in education today.
“If you were to step back and look at that from a macro-public policy standpoint, I don’t think that it’s the solution you would choose,” he said. “But the genie is out of the bottle on that deal.”
Citations
- Saul Hubbard, “Out-of-State ’O’ffensive,” The Register-Guard (Eugene, OR, October 7, 2017): .
- Ibid.
- Ibid.
- Matthew Quirk, “The Best Class Money Can Buy,” The Atlantic (Washington, DC, November 2005): .
- Hubbard, “Out-of-State ’O’ffensive.”
- Data on non-need-based aid and financial need came from the University of Oregon’s 2015–16 Common Data Set.
- Hubbard, “Out-of-State ’O’ffensive.”
- Under the program, Pathway Oregon, students from Oregon who graduated from a high school in the state in the past two years, earned at least a 3.4 GPA, and are eligible Pell Grants will have their tuition and fees covered by federal, state, and institutional grants. Much of the funding for the program came from Connie and Steve Ballmer, the former CEO of Microsoft and owner of the Los Angeles Clippers. For more on the program, see .
...And Moving in the Right One
Like Thompson, Don Witt, the University of Kentucky’s former associate provost for enrollment management, had expressed concerns about how public flagship and research universities are trying to outgun each other for high-achieving, affluent students by spending more and more on “merit” scholarships.
“It’s like an arms race, and where will it end?” Witt asked during a 2014 interview with the Lexington Herald-Leader. “I do think that it will take an institution to be that leader at some point to question the process, but who will step up? It’s a challenge that needs to be addressed at some point, and it’s a serious one. How do we stop this cycle and change things?”1
But unlike Thompson, Witt didn’t just throw up his hands and double down on the approach he was bemoaning. Instead, thanks to Witt and his colleagues, the University of Kentucky may just be that leader. The question now is whether other public universities will follow.
No, the University of Kentucky is not completely disarming. But in January 2017, it announced that it planned to significantly scale back its use of merit aid and make need-based aid the predominant form of assistance it awards.2 At that time, the university was spending 90 percent of its institutional aid dollars on students who lacked financial need. By 2021, the university plans to spend two-thirds of its aid budget on need-based aid.3
University officials said that while heavy use of non-need-based aid helped the school attract top students, it was hurting retention and completion rates. In examining data on students who had dropped out of the university, they found that many financially needy students were leaving because the school had not come close to meeting their need.4 In 2015–16, for example, the university filled just 54 percent of the need of freshmen who received financial aid. And only 21 percent of these students had their full need met.5 Meanwhile, the lowest-income, in-state freshmen paid an average net price of $13,535.
University researchers found that students with $5,000 or more in unmet need6 (the amount of financial need the government assumes that a student has minus any grant and scholarship aid received) were far more likely to drop out—no matter how well they were doing in their classes—than those with less. Nearly a quarter of the university’s students have a financial gap that wide.7 Insufficient financial aid packages were “the single most important factor” preventing students from completing their studies, Tim Tracy, the university’s provost, said at the time of the announcement.8
University officials believe that making a much more substantial investment in need-based aid will help them achieve their goals of raising their six-year graduation rates from 63.5 percent to 70 percent and their first-to-second-year retention rates from 82.7 percent to 90 percent by 2020.9
The school has a very practical reason for wanting to get those rates up. The state of Kentucky is starting a performance-based funding plan that will reward its public colleges and universities for their success in retaining and graduating students. Critically, the state provided a premium for graduating low-income and minority students.10
In examining data on students who had dropped out of the university, they found that many financially needy students were leaving because the school had not come close to meeting their need.
Some in the enrollment management field think that the pressure to improve graduation and retention rates, particularly among financially needy students, could push other public universities to follow a similar path as the University of Kentucky’s.
“With declining demographics across the nation, schools are now focused on initiatives aimed at improving student retention,” Rosemaria Martinelli, a senior director with Huron Consulting Group’s higher education division who worked with the university on the plan, told Inside Higher Ed in January 2017. “Shifting institutional dollars focused on merit to need-based aid is one strategy that has been found to be successful, particularly for students where large unmet need has been found to be one of the barriers to student success.”11
Witt, who is now the university’s assistant vice president for philanthropy, is hopeful that the University of Kentucky’s example will be instructive to other schools looking to escape the harmful cycle. “It’s exciting to be able to support more deserving students who want to pursue their college degree at the University of Kentucky,” he said at the time the university announced its plan. “This is an important step for not only UK but for higher education in general.”
Citations
- Linda B. Blackford, “As University of Kentucky Competes for Top Students, More Lower-Income Kids Left Behind,” the Lexington Herald-Leader (Lexington, KY, July 19, 2014): .
- Rick Seltzer, “Kentucky’s Need-Based Aid Gamble,” Inside Higher Ed (Washington, DC, January 24, 2017): .
- Ibid.
- Ibid.
- Data on financial need came from the University of Kentucky’s 2015–16 Common Data Set.
- To be clear, $5,000 in unmet need does not equate to a $5,000 average net price. Using data from the federal student financial aid application (FAFSA), the government determines a student’s need, based largely on income, assets, and the number of kids in that student’s family who are in college. Colleges use need-based aid to try to fill that need. When they come up short, there is unmet need. In contrast, the average net price is the sticker price minus any grant and scholarships the students receive. To illustrate the difference, imagine that you are a low-income student and you want to go to a school has a total cost of attendance of $30,000. Meanwhile, the federal government has told you that you have financial need of $25,000, but the school is able to provide you only $20,000 in federal, state, and institutional grants and scholarship. Your unmet need is $5,000 ($25,000 – $20,000), and the average net price you must pay is $10,000 ($30,000-$20,000).
- Seltzer, “Kentucky’s Need-Based Aid Gamble.”
- Linda Blackford, “Too Many Students Can’t Pay for College. So UK Is Making a Major Change to Help,” the Lexington Herald-Leader (Lexington, KY, October 21, 2016): .
- Ibid.
- Seltzer, “Kentucky’s Need-Based Aid Gamble.”
- Ibid.
Conclusion
In our Undermining Pell series, we have shown how the nation’s public colleges and universities have steadily become less affordable for low-income students.
In our first report, we found that about one-third of these institutions charged students from families making $30,000 or less an average net price of $10,000 or more in the 2010–11 academic year.1 Now we are reporting that, for the first time, more than half of these institutions are charging that much.
Our finding that public four-year colleges, which have historically given low-income and working-class students a leg up, are becoming less accessible and affordable should set off alarm bells throughout higher education and among federal and state policymakers. Instead of reducing inequality, too many of these schools are reinforcing it.
To be sure, a significant number of public colleges and universities are staying true to their mission by keeping their prices low and/or providing generous amounts of need-based aid to the substantial number of low-income students they enroll. These schools are run by leaders like Nancy Cantor, the chancellor of Rutgers University at Newark, and Matthew Holland, the former president of Utah Valley University, who believe that public institutions should value inclusiveness over exclusivity.
But, unfortunately, for every Rutgers-Newark and Utah Valley, there are more public universities like Temple University that have lost track of their historic mission while worshipping at the altar of the U.S. News rankings and pursuing greater prestige. Many of these schools spend tens of millions of dollars lavishing scholarships on upper-middle income, mostly white students from the suburbs or other states, while students with the most financial need are charged a hefty price.
Public four-year colleges, which have historically given low-income and working-class students a leg up, are becoming less accessible and affordable should set off alarm bells.
That’s not to say that the leaders of these institutions are the only ones at fault. When it comes to the increasing privatization of public higher education, there is much blame to go around — from governors and state legislators who have slashed funding for higher education to business-minded trustees who too often have little regard for the public mission of the schools.
So what can be done to reverse course and put an end to the merit-aid arms race?
The University of Kentucky’s plan to scale back its use of merit aid may be instructive. University officials came to their decision as the state of Kentucky was finalizing a performance-based funding plan that will provide a significant premium to its public universities for graduating low-income and minority students. As a result, reinvesting in need-based aid and getting more of these students to graduate promised a substantial pay-off for the school.
According to a report from the Center for Law and Social Policy (CLASP), more than two-thirds of states employ or are planning to employ some form of performance-based funding in financing their public colleges, but “only a few states have tied a significant percentage of state funding to outcomes.”2 Without enough funding on the line, schools may have little incentive to change their practices. In addition, performance-based plans that reward universities only for retaining and graduating students or that don’t have strong enough “equity measures” may inadvertently discourage schools from enrolling low-income students who are more at risk of dropping out than more-affluent students.
Therefore, as the CLASP report emphasizes, any “equity measures” that are included in performance-based plans need to be strong enough—and tied to enough money—that they can “counteract the strength of the incentives to increase selectivity.”3 The Kentucky plans seems to fit the bill and to offer a model for other states.4 But expecting all states to pursue such measures on their own—or even to recognize the need for such action—isn’t realistic.
That’s where the federal government should step in and provide incentives to states to design such plans. We’re not ready to suggest what those incentives should be just yet. We agree with CLASP that more study is needed to determine what kinds would be most effective.
Expecting all states to pursue such measures on their own—or even to recognize to recognize the need for such action—isn’t realistic.
That’s one possible approach to combating the problems identified in this report.
At Â鶹ąű¶ł´«Ă˝, we have also offered a much more ambitious approach. In our 2016 report Starting from Scratch, we proposed replacing the country’s federal financial aid system—Pell Grants, federal loans, and higher education tax credits—with a new federal-state partnership program that would eliminate unmet financial need for all students. Instead, the price students would pay would be limited to their Expected Family Contribution, the amount the government determines a household can afford to contribute toward the education of their children. Federal, state, and institutional funds would make up the difference between students’ EFC and the net price at the participating institution.5
A third possibility is a new proposal that would keep the current system but create a cutoff for federal financial aid for colleges that cover, on average, less than half of the financial need of federal financial aid recipients. This would be an extreme approach, but one that is worth examining if it is the only way to force these institutions to stop undermining national college access goals. Since this plan is aimed at improving colleges’ practices rather than punishing them, schools that miss the cutoff would have at least two years to come into compliance. This hammer-like approach may have, among the three proposals, the greatest chance of moving forward since it would surely be attractive to fiscally conservative policymakers who are looking for ways to reduce federal spending.
Regardless of which approach policymakers take, it is absolutely vital they act to put the brakes on the merit-aid arms race, which has done great harm to the college aspirations of low-income and working-class students.
For the good of the country, we must do all we can to ensure that colleges live up to their commitments to serve as engines of opportunity, rather than as perpetuators of inequality.
Citations
- Burd, “Undermining Pell.”
- Anna Cielinski and Duy Pham, “Equity Measures in State Outcomes-Based Funding: Incentives for Public Colleges to Support Low-Income and Underprepared Students,” Center for Law and Social Policy’s Center for Postsecondary and Economic Success (Washington, DC, February 2017):
- Ibid.
- “Postsecondary Education Work Group Report,” Kentucky Panel on Postsecondary Education (Frankfort, KY, December 1, 2016): .
- Ben Barrett, Stephen Burd, Kevin Carey, Kim Dancy, Manuela Ekowo, Rachel Fishman, Alexander Holt, Amy Laitinen, Mary Alice McCarthy, and Iris Palmer, “Starting from Scratch: A New Federal and State Partnership in Higher Education,” (Washington, DC: Â鶹ąű¶ł´«Ă˝, February 2016), 8d72818d45e4cf18327b0ff2bd8f85b.pdf.
Appendix
Error: Data visualization bundle URL missing.
- Introduction
- Methodology
- Public University Results
- Public University Trends
- Taking a Look at the States
- Best of the Best: Very High Pell, Low Net Price
- The Next Best: High Pell, Low Net Price
- Country-Club Public Universities: Low Pell, Low Net Price
- High-Net Price Public Universities
- Moving in the Wrong Direction…
- ...And Moving in the Right One
- Conclusion
- Appendix
More Â鶹ąű¶ł´«Ă˝ the Author

Stephen Burd
Senior Writer & Editor, Higher Education