Nicole Hsu
Policy Analyst, Early & Elementary Education
A Series on Early Development and Disability

“Two and a half year old Levi loves to play and run around. He also has some delays that have concerned his mom, Olivia Ippolito, since he was a baby. Developmentally, she says, he’s about 18 months old. He was late to walk and struggles with speaking.” This is the start of a Rhode Island PBS Weekly narrated by reporter Steph Machado that aired last September. The episode details Olivia’s nine month journey to get Levi occupational therapy services after his pediatrician made a referral—a process that should take 45 days according to federal law. “I didn’t realize it would take that long and then I would have to hound people for so long,” says Olivia.
The first few years of a child’s life are a critical window of opportunity to connect families to (EI) services—often provided at no cost to families—but there exist in who ultimately enrolls that cannot be explained by alone or by differences in need. Asian, Hispanic, and Black children are less likely than White non-Hispanic children to receive EI services such as physical therapy, audiology, or infant mental health.
A from the Government Accountability Office (GAO) suggests that better, disaggregated data on each of the stages prior to enrollment could help identify and address disparities of access for families seeking EI services. The report analyzed state Part C of the Individuals with Disabilities Education Act (Part C) submitted to the Department of Education (ED) and data. GAO also surveyed all state Part C programs, with responses from 54 out of 56 programs, and interviewed ED staff and representatives from technical assistance centers.
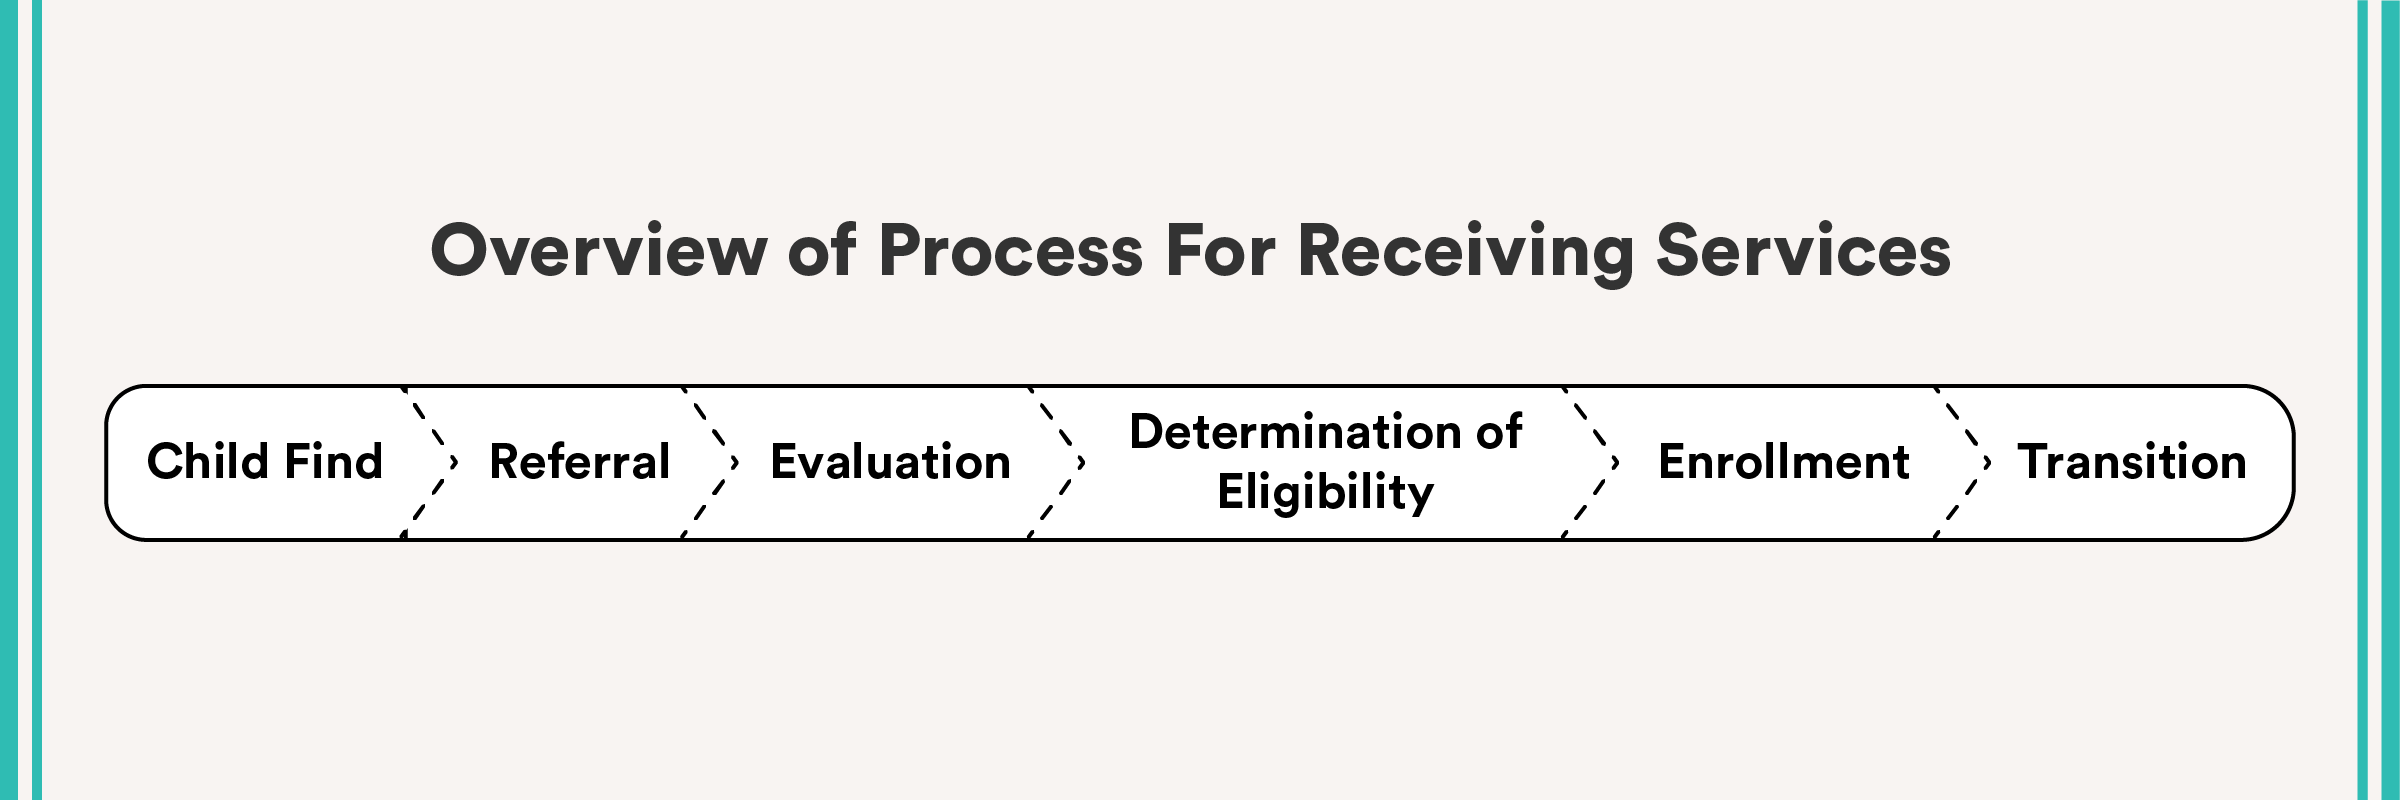
The survey asked states to report the number, race, and ethnicity of children from birth through age two who were identified (or referred), evaluated, determined eligible, and enrolled in Part C programs (see graphic above for an overview of this process). This information is significant because states are not required to report data on children who are identified, evaluated, and determined eligible to the federal government. Moreover, many states disaggregated data on these steps. The report emphasizes how comparing across different characteristics at each stage of the process enables state-level staff working on Part C to “pinpoint what subgroups of infants and toddlers are disproportionately not progressing to the next stage of the Part C enrollment process and at which stage this is occurring.”
With these data, report authors examined enrollment process patterns both nationally and across states. Nationally, about one half of children referred for services ultimately enroll, and this ranges from 28 percent in American Samoa to 90 percent in the U.S. Virgin Islands. In addition, the percentage of children who progress to the next stage from the prior stage increases as they move through the process, suggesting that children are enrolling in services once they are determined eligible.

If we take a closer look across states, however, the data reveal state variations in the percentage of children who move to the next step from the prior stage. Some of this may be due to children moving out of state, parents not providing consent for their child’s evaluation, or differences in the state’s eligibility criteria. For example, across the 54 states that responded to the survey, there were 620 unique conditions that qualify a child for Part C services—with one state listing 167 conditions—illustrating how much variability there is among state eligibility criteria.

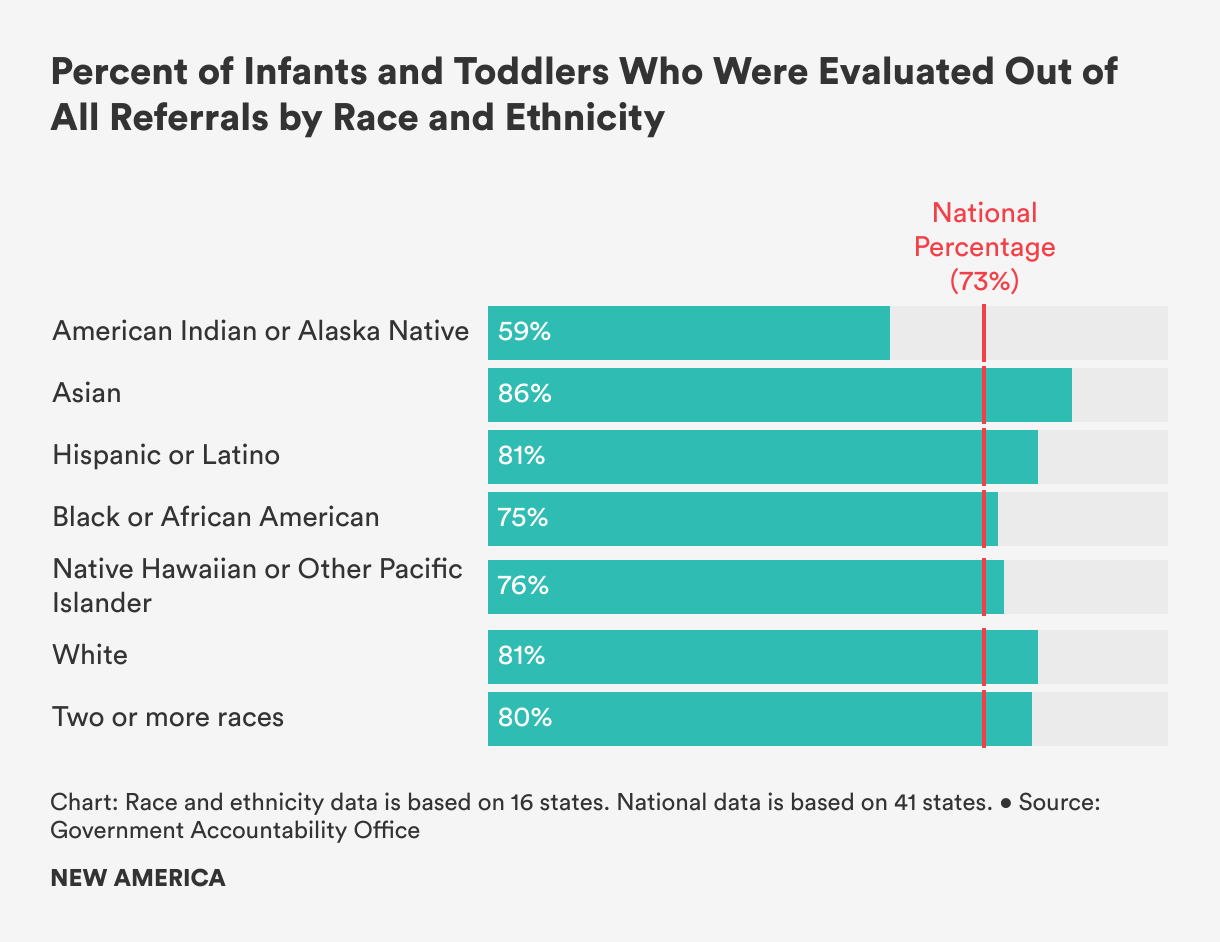
With disaggregated race and ethnicity data, policymakers can identify disparities and develop solutions to make EI service access more equitable. Only sixteen states provided usable race and ethnicity data at each stage of the enrollment process (). Of those states, the largest difference by race was at the start of the process. The percentage of children who were evaluated out of those who were referred ranged from 59 percent for American Indian or Alaska Native children to 86 percent for Asian children (see figure below). There was less of a difference in the subsequent stages, with a 15 percentage point spread for children who were found eligible after being evaluated and a four percentage point spread for children who enrolled after being determined eligible.
The report recommends the ED encourage states to use existing demographic data to improve efforts to identify, evaluate, and maximize children’s access to Part C services. They also suggest providing the ED with the authority to collect demographic data from states on children at each stage of the process and requiring the ED to use these data to better assist states in understanding who moves through each stage of the process to the next.
To support these data practices, state-level staff working on Part C need and training to analyze such data. In addition, meeting the commitment for full inclusion of young children with disabilities—which starts with access to EI—will require adequate attention to other longstanding challenges such as eligibility criteria, staffing shortages, and reimbursement rates. Without doing so, more families will continue to have experiences similar to Levi and Olivia.
Future blogs will investigate these challenges and how they impact who can access services at an early age.
Policy Analyst, Early & Elementary Education